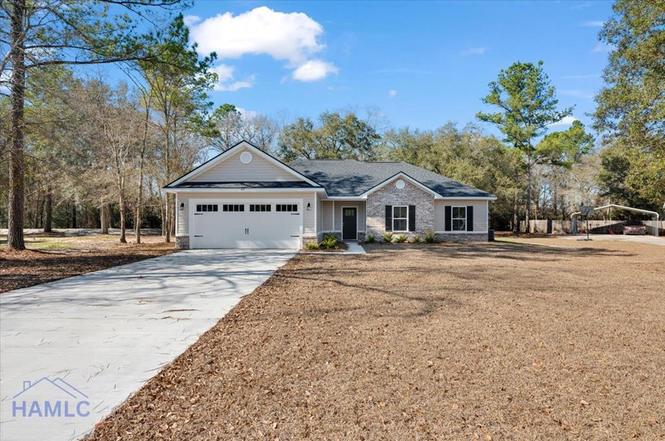
Lot 48 Carlyene Dr
Midway, GA 31320
$288,900F
3 bd · 2.0 ba ·
1,534 sqft ·
Built 2026
· SingleFamily
· Pending
· 22 DOM
Cashflow @ list (25.0% down · 7.5%)
Estimated rent
$2,103/mo
Mortgage (P&I)
−$1,515
Tax + insurance
−$369
HOA
−$0
Vac / Maint / Mgmt
−$442
Net cashflow
$-223/mo
Annual
$-2,674/yr
Cap rate
5.37%
Cash-on-cash
-3.31%
DSCR
0.85
1% rule
0.73%
Cash to close
$80,892
Investor read
- This is a 3-bed/2.0-bath single-family listed at $289k.
- At list price, monthly cash flow is $-223 ($-3k/yr) — negative.
- To cash-flow at today's rent, offer at most $250k (13.6% below list).
- To meet the 1% rule (rent ≥ 1% of price), the offer needs to be $210k (27.2% below list).
- It's been on market 22 days — a 2% lower offer ($285k) is reasonable based on typical stale-listing flexibility.
- Recommended offer: $210k (27.2% below list) — sets the bar for 1% rule.
- Local home prices are declining (-3.0%/yr); year-one equity from $2k of loan paydown is wiped out by about $9k of value loss. Plan a longer hold.
- Location reads 65/100 on livability (#219 in GA) — a middle-class / working-renter tenant base. Strengths: crime A+, cost of living A+, housing A+; Watch: schools D-, amenities F, commute F.
- Liberty County (urban): math 19% / reading 28% proficiency, ranked #133 of 174 in GA (top 76%) — low school quality limits family demand, transient renter base, plan for 1-2y turnover.
- Market conditions: 211 active listings in the ZIP; 1 comparable units currently listed for rent nearby; solid renter incomes; 471 units permitted in Liberty County in 2024 (0 in 5+ unit buildings).
- Liberty County population projected to shrink 8% by 2050 — rents likely to lag national; underwrite the cash flow, not the appreciation.
- 5 sale attempts since 14y ago with the ask held roughly flat each time — persistent listings suggest the price (not the market) is what's stuck; bring a comps-based counter.
- Current owner paid $187k; list at $289k implies a 54% gain — meaningful room to come down on a strong offer.
- Climate carrying-cost: severe wind risk, 99% chance of damaging wind over 30y; moderate wildfire risk; extreme-heat days projected 7→18/yr by 2055 (HVAC capex compounding) — expect insurance premiums to compound above CPI over the hold.
- Cap rate 5.4% vs local median 4.3% in Midway — meaningfully above typical; check what's discounted (condition, days-on-market, listing class) to confirm the premium yield is real.
- This rent runs 33% of the median local income ($77k/yr) — at the standard rent-burdened threshold; future hikes will face affordability resistance.
Questions for listing agent
- What do current leases actually rent for vs. the listed asking? Can we see a recent rent roll and the last 12 months of T-12 income?
- Is there a deadline driving the sale (1031 exchange, divorce, estate, relocation)? That informs how much negotiation room exists.
- Schools are D-rated, which usually means shorter tenancies and higher turnover. Who's the typical renter profile here, and what's been the actual vacancy rate?
- The area grade is low — what's the realistic commute time and amenity access for the typical tenant pool here? Any planned neighborhood developments (good or bad) we should know about?
- This sits on a lake — are riparian / water-frontage rights deeded with the parcel? Any dock permits, shoreline easements, or HOA water-use restrictions?
- What's the documented flood / surge / shoreline-erosion history here (FEMA AND non-FEMA — e.g., storm surge, creek backup, septic-field saturation)?
- Any water-quality or seasonal algae-bloom issues that affect tenant satisfaction or short-term-rental demand?
- What's the average days-on-market for RENTAL listings here right now (not sales)? A rising rental-DOM trend means longer vacancies and softer asking-rent achievability than the comps imply.
CashFlowRE · CFR-EMTAT42PX30WVX
· Data 3 weeks ago
cashflowre.app · 2026-05-29