 🌊 Lakefront
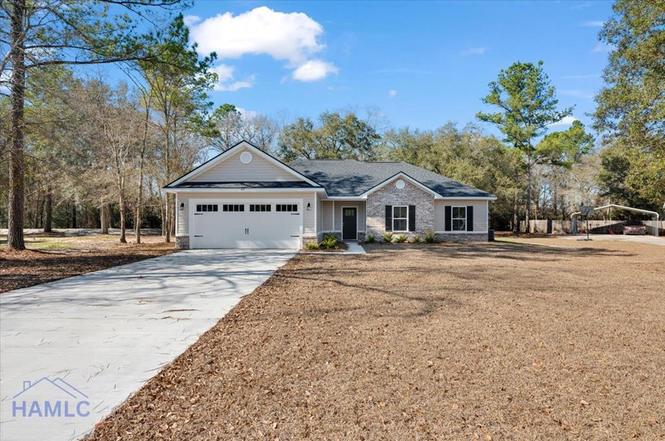
Lot 48 Carlyene Dr · Midway, GA
Flood risk 1/10 · Minimal
- FEMA flood zone
- X (unshaded)
- Chance of flooding over 30 yrs
- 0.0%
- Est. flood insurance / yr
- $507 – $1,088
Fire risk 5/10 · Moderate
- Est. fire insurance / yr
- $963 – $1,789
Heat risk 9/10 · Severe
- Hot days now (above 107°F)
- 7 days/yr
- Hot days in 30 yrs
- 18 days/yr
Wind risk 9/10 · Severe
- Chance of severe wind over 30 yrs
- 99.0%
Air-quality risk 2/10 · Minimal
- Unhealthy air days now
- 2 days/yr
- Unhealthy air days in 30 yrs
- 2 days/yr
Risk factors via First Street. Map © Google.
Why this score? — see what drove the F grade
The composite is a weighted blend of 9 inputs, each scored 0–100. Each bar is that input's sub-score; the figure is the points it added to the 100-point composite (weight × sub-score).
- Cash flow +9.1/30.0
- ARV discount +9.0/15.0
- Livability +3.2/5.0
- DSCR +2.5/10.0
- Rent growth +2.5/5.0
- Condition / age +2.5/5.0
- 1% rule +2.3/10.0
- Schools +2.0/10.0
- Appreciation +0.0/10.0
$288,900
🖨 Deal sheet 📄 Offer letter ✓ Due diligence
Listing remarks MLS
Beautiful all brick home located in Isle of Wright Subdivision. This wonderful property features 3 bedroom, 2.5 bathrooms, Living room with fireplace, Huge laundry room with bathroom, 2 enclosed patios that overlooks the lake, beautiful lakefront view with Dock , 2 storage sheds with electricity and hangar for a RV. This rare lakeview property is looking for its new owner and won't last long.
Key facts
- Lvt flooring
- 0.88 acre lot
- 2 garage spots
Tags
Neighborhood map
What this means for you Summary
Snapshot
- This is a 3-bed/2.0-bath single-family listed at $289k.
Deal economics
- At list price, monthly cash flow is $-223 ($-3k/yr) — negative.
- To cash-flow at today's rent, offer at most $250k (13.6% below list).
- To meet the 1% rule (rent ≥ 1% of price), the offer needs to be $210k (27.2% below list).
- Recommended offer: $210k (27.2% below list) — sets the bar for 1% rule.
- Cap rate 5.4% vs local median 4.3% in Midway — meaningfully above typical; check what's discounted (condition, days-on-market, listing class) to confirm the premium yield is real.
Location & tenants
- Location reads 65/100 on livability (#219 in GA) — a middle-class / working-renter tenant base. Strengths: crime A+, cost of living A+, housing A+; Watch: schools D-, amenities F, commute F.
- Liberty County (urban): math 19% / reading 28% proficiency, ranked #133 of 174 in GA (top 76%) — low school quality limits family demand, transient renter base, plan for 1-2y turnover.
- Market conditions: 211 active listings in the ZIP; 1 comparable units currently listed for rent nearby; solid renter incomes; 471 units permitted in Liberty County in 2024 (0 in 5+ unit buildings).
- This rent runs 33% of the median local income ($77k/yr) — at the standard rent-burdened threshold; future hikes will face affordability resistance.
Forward outlook
- Local home prices are declining (-3.0%/yr); year-one equity from $2k of loan paydown is wiped out by about $9k of value loss. Plan a longer hold.
- Liberty County population projected to shrink 8% by 2050 — rents likely to lag national; underwrite the cash flow, not the appreciation.
Negotiation context
- It's been on market 22 days — a 2% lower offer ($285k) is reasonable based on typical stale-listing flexibility.
- 5 sale attempts since 14y ago with the ask held roughly flat each time — persistent listings suggest the price (not the market) is what's stuck; bring a comps-based counter.
- Current owner paid $187k; list at $289k implies a 54% gain — meaningful room to come down on a strong offer.
Risks & watch-outs
- Climate carrying-cost: severe wind risk, 99% chance of damaging wind over 30y; moderate wildfire risk; extreme-heat days projected 7→18/yr by 2055 (HVAC capex compounding) — expect insurance premiums to compound above CPI over the hold.
Questions for the listing agent
- What do current leases actually rent for vs. the listed asking? Can we see a recent rent roll and the last 12 months of T-12 income?
- Is there a deadline driving the sale (1031 exchange, divorce, estate, relocation)? That informs how much negotiation room exists.
- Schools are D-rated, which usually means shorter tenancies and higher turnover. Who's the typical renter profile here, and what's been the actual vacancy rate?
- The area grade is low — what's the realistic commute time and amenity access for the typical tenant pool here? Any planned neighborhood developments (good or bad) we should know about?
- This sits on a lake — are riparian / water-frontage rights deeded with the parcel? Any dock permits, shoreline easements, or HOA water-use restrictions?
- What's the documented flood / surge / shoreline-erosion history here (FEMA AND non-FEMA — e.g., storm surge, creek backup, septic-field saturation)?
- Any water-quality or seasonal algae-bloom issues that affect tenant satisfaction or short-term-rental demand?
- What's the average days-on-market for RENTAL listings here right now (not sales)? A rising rental-DOM trend means longer vacancies and softer asking-rent achievability than the comps imply.
- What's the recent tenant-quality profile in this submarket — average credit score on applications, eviction rate, late-payment / NSF rate, and stable-employment percentage? A property-management company in the area should have these aggregated.
- How much new for-sale + rental construction is in the pipeline within 1–3 miles? Heavy new supply typically softens prices + rents 12–24 months out; constrained supply supports both.
Investment metrics
- 1% rule
- 0.73% ✗
- Cap rate
- 5.37%
- Cash-on-cash
- -3.31%
- DSCR
- 0.85
- GRM
- 11.4
CMA / ARV
- ARV (on-the-fly)
- $299,130
- Comps found
- 12
Show comp detail 12 sales within ~0.75 mi
| Address | Dist | Beds/Ba | Sqft | Sold | Price | $/sf | Match |
|---|---|---|---|---|---|---|---|
| 260 W 1st St | 0.18mi | 4/2.0 (+1) | 1,525 (-1%) | 4mo | $218,000 | $143 | 83 |
| 259 Islands Dr | 0.21mi | 4/2.0 (+1) | 1,542 (+0%) | 4mo | $247,000 | $160 | 80 |
| 514 W 1st St | 0.36mi | 3/2.0 | 1,525 (-1%) | 20mo | $290,000 | $190 | 66 |
| 337 Island Dr | 0.26mi | 3/2.5 | 1,642 (+7%) | 10mo | $324,900 | $198 | 65 |
| 337 Island Dr | 0.26mi | 3/2.5 | 1,642 (+7%) | 10mo | $324,900 | $198 | 65 |
| 597 Tideland Dr | 0.58mi | 3/2.0 | 1,531 (-0%) | 12mo | $405,000 | $265 | 63 |
| 237 W 1st St | 0.17mi | 3/2.0 | 1,702 (+11%) | 13mo | $332,000 | $195 | 63 |
| 613 Tideland Dr | 0.57mi | 3/3.0 | 1,614 (+5%) | 0mo | $410,000 | $254 | 60 |
| 622 W 1st St | 0.43mi | 2/2.0 (-1) | 1,452 (-5%) | 15mo | $244,000 | $168 | 53 |
| 3353 Isle Of Wight Rd | 0.64mi | 4/2.5 (+1) | 1,640 (+7%) | 11mo | $285,000 | $174 | 43 |
| 228 Circle Rd | 0.59mi | 3/2.0 | 1,314 (-14%) | 9mo | $147,500 | $112 | 41 |
| 271 Pinetree Rd | 0.69mi | 3/2.0 | 1,656 (+8%) | 22mo | $367,000 | $222 | 36 |
Match score weights: distance 35% · size 25% · config 20% · recency 20%. Top-matched comps best support the ARV.
Projected returns pro-forma
-3.0% appreciation · 3.0% rent growth · sell at horizon
- IRR
- -21.9%
- Equity multiple
- 0.25×
- Total profit
- $-61,042
- Equity at exit
- $43,076
- IRR
- -15.7%
- Equity multiple
- 0.12×
- Total profit
- $-71,579
- Equity at exit
- $24,979
Cash invested: $80,892 (down + closing). Projections, not guarantees.
Landlord ↔ Tenant lean methodology
- Overall (STATE)
- 90 Strongly Landlord-Friendly
- State Georgia
- 90 Strongly Landlord-Friendly · R+3
- County
- — inherits STATE
- City
- — inherits STATE
ZIP-level market 31320
- Home prices YoY
- -9.7%
- Active inventory
- 211
- Price-to-rent
- 11.4×
Monthly cashflow live
- Estimated rent
- $2,103 medium interval (Pro) →
- Mortgage (P&I)
- −$1,515
- Tax from tax record
- −$249 /mo · $2,983/yr
- Insurance
- −$120
- HOA
- −$0
- Vacancy / Maint / Mgmt
- −$442
- Net cashflow
- $-223
Break-even live
UW: 25.0% down · 7.5% · 30yr · 1.5% tax · 5.0% vac · 8.0% maint · 8.0% mgmt
Financing live
Cash to close
- Down payment
- $72,225
- Closing costs
- $8,667
- Reserves months
- —
- Total cash needed
- —
Loan-product check · same deal, 3 products live
Conventional
25% down · 7.5% · 30yr
- Down + closing
- —
- Monthly P&I
- —
- Monthly cashflow
- —
- DSCR
- —
- Eligible?
- —
Personal DTI + credit; lowest rate.
DSCR
20% down · 8.5% · 30yr
- Down + closing
- —
- Monthly P&I
- —
- Monthly cashflow
- —
- DSCR
- —
- Eligible?
- —
No personal income docs; deal must DSCR.
Hard money
10% down · 12.0% · 12mo
- Down + closing
- —
- Monthly P&I
- —
- Monthly cashflow
- —
- DSCR
- —
- Eligible?
- —
Short-term bridge; refi at stabilization.
Rent comps 1 comps
| Address | Beds | Baths | Sqft | Rent | $/sqft | DOM | Units | Dist |
|---|---|---|---|---|---|---|---|---|
| 491 Lake Rosalind Dr Midway, GA | 4.0 | 2.0 | 1450 | $2,600 | $1.79 | 14d | 1 | 0.12mi |
Listing history 11 events
-
2026-03-20status Pending
-
2026-02-26$288,900 Active
-
2018-12-13soldstatus $187,000 396-char remark
Show marketing remark (395 chars)
Beautiful all brick home located in Isle of Wright Subdivision. This wonderful property features 3 bedroom, 2.5 bathrooms, Living room with fireplace, Huge laundry room with bathroom, 2 enclosed patios that overlooks the lake, beautiful lakefront view with Dock , 2 storage sheds with electricity and hangar for a RV. This rare lakeview property is looking for its new owner and won't last long.
-
2018-12-13soldstatus $187,000 395-char remark
Show marketing remark (395 chars)
Beautiful all brick home located in Isle of Wright Subdivision. This wonderful property features 3 bedroom, 2.5 bathrooms, Living room with fireplace, Huge laundry room with bathroom, 2 enclosed patios that overlooks the lake, beautiful lakefront view with Dock , 2 storage sheds with electricity and hangar for a RV. This rare lakeview property is looking for its new owner and won't last long.
-
2018-09-29$189,000 396-char remark
Show marketing remark (395 chars)
Beautiful all brick home located in Isle of Wright Subdivision. This wonderful property features 3 bedroom, 2.5 bathrooms, Living room with fireplace, Huge laundry room with bathroom, 2 enclosed patios that overlooks the lake, beautiful lakefront view with Dock , 2 storage sheds with electricity and hangar for a RV. This rare lakeview property is looking for its new owner and won't last long.
-
2018-09-29$189,000 395-char remark
Show marketing remark (395 chars)
Beautiful all brick home located in Isle of Wright Subdivision. This wonderful property features 3 bedroom, 2.5 bathrooms, Living room with fireplace, Huge laundry room with bathroom, 2 enclosed patios that overlooks the lake, beautiful lakefront view with Dock , 2 storage sheds with electricity and hangar for a RV. This rare lakeview property is looking for its new owner and won't last long.
-
2014-06-16soldstatus $153,900
-
2014-06-11soldstatus $153,900
-
2013-04-16$159,700
-
2012-10-13historical
-
2012-04-20$249,900
ⓘ Source: listings_history table (triggers on properties + properties_extension) + one-shot
backfill from property_details.listing_events for pre-trigger history.
Tax reassessment forecast GA · Resets to sale price
- Current annual tax
- $2,983 · $249/mo
- Projected year-2 tax
- $2,983 · $249/mo
- Expected delta
- $0/yr ($0/mo · 0.0%)
ⓘ Screening estimate from a state-policy table — verify with the county assessor before closing.
Climate risk First Street
- Flood 1/10 Low FEMA zone X (unshaded) · 0% chance over 30 yrs
- Wildfire 5/10 Major
- Heat 9/10 Extreme 7 d/yr ≥107°F today · 18 d/yr by 30 yrs out
- Wind 9/10 Extreme 99% chance of damaging wind over 30 yrs
- Air quality 2/10 Low 2 unhealthy d/yr today · 2 by 30 yrs out
Nearby sold comps map
Loading sold comps map…
Walkable amenities ~0.75 mi
Loading nearby amenities…
Taxation est. · year 1
- Rental income
- $25,233
- − Mortgage interest
- −$16,183
- − Property taxes
- −$2,983
- − Insurance
- −$1,444
- − Repairs & maintenance
- −$2,019
- − Management
- −$2,019
- − Depreciation
- −$8,404
- Taxable loss
- −$7,819
- Est. tax savings @ 24.0%
- +$1,877
- After-tax cash flow
- $-797/yr
For passive investors: Depreciation is non-cash, so a rental often shows a tax loss while cash-flowing — sheltering income. Rental losses are passive: they offset passive income freely, and up to $25,000/yr can offset ordinary (W-2) income if you actively participate and your MAGI is under $100k (phasing out to $0 by $150k); unused losses carry forward. On sale, claimed depreciation is recaptured at up to 25%, and gains may owe capital-gains tax (a 1031 exchange can defer both). Figures are a year-1 estimate at your 24.0% rate — not tax advice; consult a CPA.
Schools (NCES district)
- District
- Liberty County
- NCES district ID
- 1303300
- Math proficiency
- 19% ▼ -16.00%
- Reading proficiency
- 28% ▼ -13.00%
- Median HH income
- $43,911
- Composite
- 20.2/100
- National rank
- #8630
- State rank
- #133 of 174 in GA
Livability — Midway
- Score
- 65/100
- State rank
- #219
- US rank
- #12952
Category grades
Schools grade is shown separately in the Schools card above.
Census & demographics
- County
- Liberty County · 58,565 people
- City population
- 10,794
- Metro
- Hinesville, GA
- Population (ZIP)
- 10,794
- Household income
- $77,195
- Rent vs Own
- Severe rent burden
- 136.0
Population outlook (Liberty County) Hauer SSP2
- Today (2025)
- 58,689 people
- By 2030
- 57,670 · -1.7%
- By 2040
- 55,750 · -5.0%
- By 2050
- 54,155 · -7.7%
- By 2075
- 58,947 · +0.4%
- By 2100
- 66,919 · +14.0%
Race, ethnicity, and origin ACS 2023
- Neighborhood character
- Diverse neighborhood (Simpson 0.57)
- Race & ethnicity
- White 56% Black 33% Two or more races 8% Hispanic / Latino 5%
- Hispanic origin (detail)
- Mexican 1% Puerto Rican 3%
- Common ancestry
- Italian 2% Slovak 2% Lithuanian 1%
- Foreign-born
- 2% · Canada
- Languages at home
- 96% English-only · Spanish 3% German/W. Germanic 1%
Political lean MEDSL · Liberty
- 2024 margin
- D (+17.4) · D 58.5% · R 41.0%
- 2008→2024 swing
- -10.9pp toward R · 2008: 28.4pp · 2024: 17.4pp
- All cycles
- 2024: D+17.4 2020: D+24.1 2016: D+21.2 2012: D+30.2 2008: D+28.4
Not yet ingested
- Civics
- —
Market trends
- HPI YoY
- ▼ -25.67%
- Current HPI
- 239.3136
- Rent YoY
- —
- Metro
- Hinesville, GA
- State GDP YoY
- ▲ 2.66%
- F500 in state
- 28
Industry mix (Fortune 500 HQ in GA)
| Industry | F500 HQs | Revenue |
|---|---|---|
| Paper / Packaging | 2 | $29B |
|
||
| Retail | 1 | $160B |
|
||
| Transportation / Logistics | 1 | $91B |
|
||
| Airlines | 1 | $62B |
|
||
| Consumer Goods | 1 | $47B |
|
||
| Utilities | 1 | $25B |
|
||
Price history
+15.6% since first listed11 events — show timeline
- 2026-03-20 Pending — HABR
- 2026-02-26 Listed $288,900 HABR
- 2018-12-13 Sold (MLS) $187,000 Hive MLS
- 2018-12-13 Sold (MLS) $187,000 HABR
- 2018-09-29 Listed $189,000 Hive MLS
- 2018-09-29 Listed $189,000 HABR
- 2014-06-16 Sold (Public Records) $153,900 Public Records
- 2014-06-11 Sold (MLS) $153,900 Hive MLS
- 2013-04-16 Listed $159,700 Hive MLS
- 2012-10-13 Listing Removed — Hive MLS
- 2012-04-20 Listed $249,900 Hive MLS
Property tax history
+5.7%/yrLatest (2025): $2,983 · +3.7% YoY. Source: county tax records.
Cash-flow waterfall
monthlySold comps — $/sqft
last 12 mo · ≤1 miLoading sold comps…