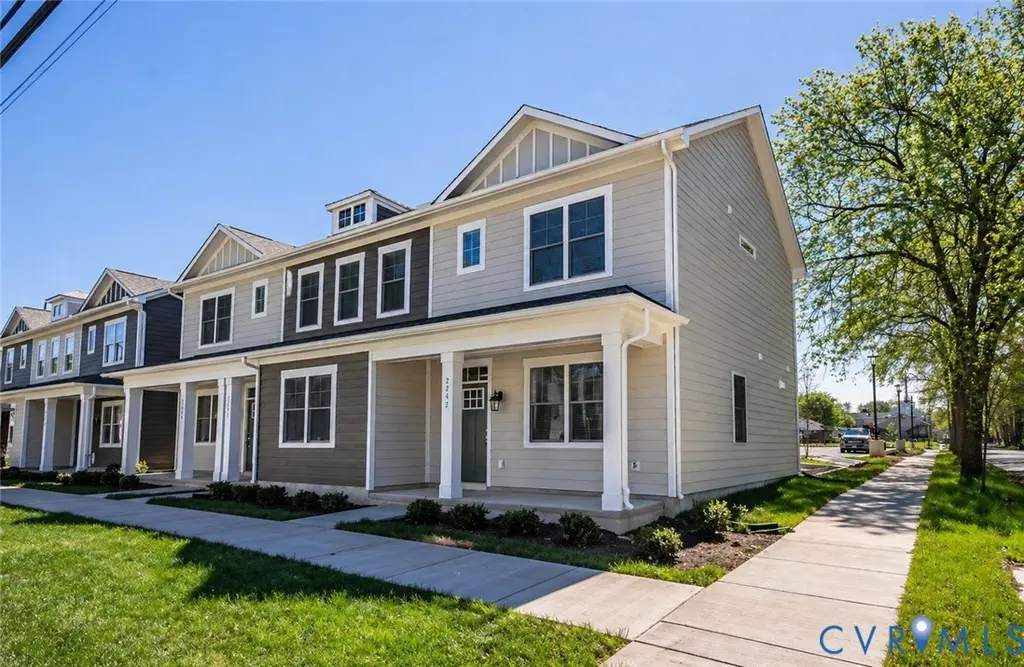
2234 Ingram Ave #5
Richmond, VA 23224
$210,000D-
3 bd · 2.5 ba ·
1,145 sqft ·
Built 2025
· Townhouse
· Active
· 19 DOM
Cashflow @ list (25.0% down · 7.5%)
Estimated rent
$1,765/mo
Mortgage (P&I)
−$1,101
Tax + insurance
−$350
HOA
−$0
Vac / Maint / Mgmt
−$371
Net cashflow
$-57/mo
Annual
$-680/yr
Cap rate
5.97%
Cash-on-cash
-1.16%
DSCR
0.95
1% rule
0.84%
Cash to close
$58,800
Investor read
- This is a 3-bed/2.5-bath townhouse listed at $210k. Condition is rated good.
- At list price, monthly cash flow is $-57 ($-680/yr) — negative.
- To cash-flow at today's rent, offer at most $202k (3.9% below list).
- To meet the 1% rule (rent ≥ 1% of price), the offer needs to be $177k (15.9% below list).
- It's been on market 19 days — a 2% lower offer ($207k) is reasonable based on typical stale-listing flexibility.
- Recommended offer: $177k (15.9% below list) — sets the bar for 1% rule.
- Local home prices are declining (-3.0%/yr); year-one equity from $1k of loan paydown is wiped out by about $6k of value loss. Plan a longer hold.
- Location reads 84/100 on livability (#33 in VA, #793 nationally) — a professional / high-income tenant draw. Strengths: amenities A+, commute A+, health & safety A+; Watch: crime D-.
- Richmond City Public School District (urban): math 32% / reading 47% proficiency, ranked #123 of 131 in VA (top 94%) — families likely to look elsewhere, expect single-tenant / working-renter base with shorter leases; 74% free/reduced lunch — lower-income household profile, screen leases tightly.
- Zoned schools: Oak Grove/Bellemeade Elementary (math 12% / reading 27%, grade F, #1,089 of 1,108 statewide, top 99%, 594 students, 99% FRL); Thomas C. Boushall Middle (math 12% / reading 27%, grade F, #340 of 342 statewide, top 99%, 611 students, 98% FRL); Armstrong High (math 12% / reading 54%, grade F, #316 of 319 statewide, top 99%, 747 students, 90% FRL) — zoned schools average 96% FRL vs 74% district-wide (22 pts higher); higher-poverty schools than district average — tighter screening recommended.
- Zoned-school proficiency averages 24% at this address vs 40% district-wide (-15 pts) — the specific schools serving this property underperform the Richmond City Public School District average; the district grade overstates school quality for this exact location.
- Market conditions: Rents rising fast (+4.5%/yr); 177 active listings in the ZIP; 40 comparable units currently listed for rent nearby; rentals at typical pace (median 17d on market — plan ~3-4 weeks tenant-placement turnaround); 2,540 units permitted in Richmond city in 2024 (2,077 in 5+ unit buildings).
- Richmond County population projected at +40% by 2050 — long-run rental-demand tailwind backs the buy-and-hold thesis.
- Cap rate 6.0% vs local median 3.2% in Richmond — top-decile yield for the area; either an underpriced asset or a hidden risk that comps aren't pricing in. Stress-test before assuming the spread holds.
- This rent runs 42% of the median local income ($50k/yr) — at the standard rent-burdened threshold; future hikes will face affordability resistance.
Questions for listing agent
- What do current leases actually rent for vs. the listed asking? Can we see a recent rent roll and the last 12 months of T-12 income?
- Is there a deadline driving the sale (1031 exchange, divorce, estate, relocation)? That informs how much negotiation room exists.
- Schools are A-rated — typically a magnet for longer-tenancy family renters. What's the average tenant stay here, and is there a school-zone premium baked into asking?
- Crime grade is D in this area — have there been break-ins, vandalism, or insurance claims at this property in the last 3 years? What carrier currently insures it and at what premium?
- The area grade is low — what's the realistic commute time and amenity access for the typical tenant pool here? Any planned neighborhood developments (good or bad) we should know about?
- What's the average days-on-market for RENTAL listings here right now (not sales)? A rising rental-DOM trend means longer vacancies and softer asking-rent achievability than the comps imply.
- What's the recent tenant-quality profile in this submarket — average credit score on applications, eviction rate, late-payment / NSF rate, and stable-employment percentage? A property-management company in the area should have these aggregated.
- How much new for-sale + rental construction is in the pipeline within 1–3 miles? Heavy new supply typically softens prices + rents 12–24 months out; constrained supply supports both.
CashFlowRE · CFR-EN5GF34684VWD5
· Data 23 h ago
cashflowre.app · 2026-05-29