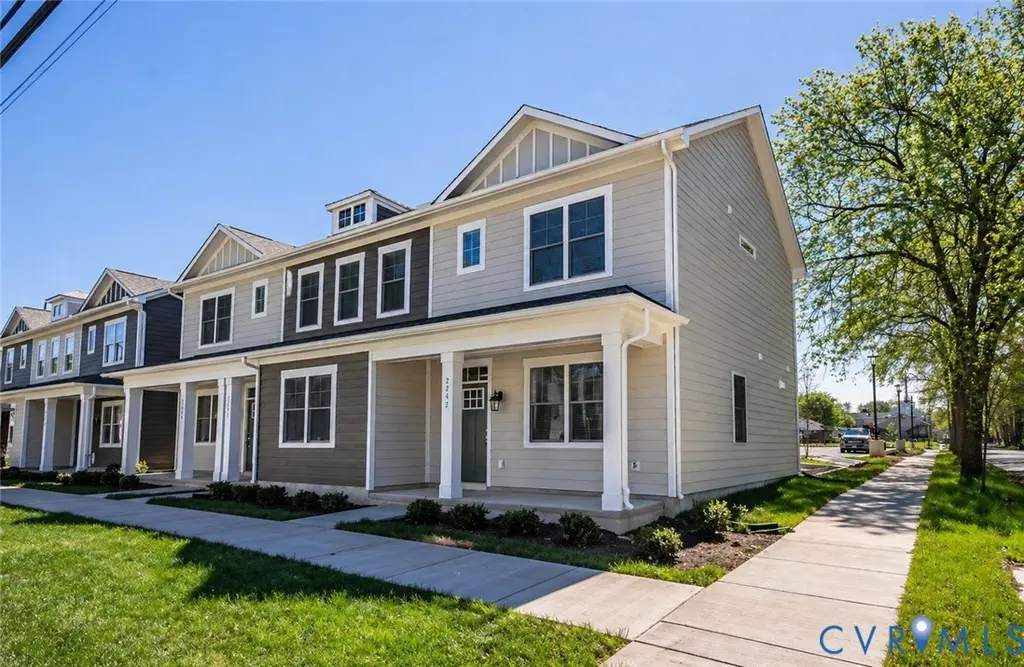
2234 Ingram Ave #5 · Richmond, VA
Flood risk No data
- FEMA flood zone
- —
- Chance of flooding over 30 yrs
- —
- Est. flood insurance / yr
- —
Fire risk No data
- Est. fire insurance / yr
- —
Heat risk No data
- Hot days now (above threshold)
- —
- Hot days in 30 yrs
- —
Wind risk No data
- Chance of severe wind over 30 yrs
- —
Air-quality risk No data
- Unhealthy air days now
- —
- Unhealthy air days in 30 yrs
- —
Risk factors via First Street. Map © Google.
Why this score? — see what drove the D- grade
The composite is a weighted blend of 9 inputs, each scored 0–100. Each bar is that input's sub-score; the figure is the points it added to the 100-point composite (weight × sub-score).
- Cash flow +11.8/30.0
- Livability +4.2/5.0
- Condition / age +4.0/5.0
- Rent growth +3.6/5.0
- DSCR +3.5/10.0
- 1% rule +3.4/10.0
- Schools +3.3/10.0
- ARV discount +2.8/15.0
- Appreciation +0.0/10.0
$210,000
🖨 Deal sheet (PDF) 📄 Offer letter ✓ Due diligence
Listing remarks
New Construction – Move-In Ready! Welcome to this beautiful 3-bedroom, 2.5-bath townhome located in the City of Richmond, just minutes from downtown, dining, entertainment, and major highways. Designed for modern, low-maintenance living, this home features an open-concept layout with stylish wood flooring throughout the main living areas. The spacious kitchen is a standout, complete with granite countertops and a large center island perfect for entertaining or everyday living. This property is part of the Maggie Walker Community Land Trust (MWCLT) program. The home improvements are available to qualified purchasers, while the land is held in trust. Homes must be owner-occupie
Key facts
- Wood flooring
- Large center island
- New construction
Tags
Property features AI
Exterior
- Parking: Driveway parking; Off-street paved parking; On-street parking available
- Utilities: Public water; Public sewer; Electric water heater
- Home design: Two-story property; New construction; Has attached property
- Construction: Shingle roof; Aluminum siding; Brick and block construction; Drywall interior
- Exterior features: Paved driveway; Stoop
Interior
- Kitchen: Electric cooking; Stove; Microwave; Dishwasher; Refrigerator; Granite counters; Pantry; Eat-in kitchen
- Bedrooms: Total rooms: 5
- Flooring: Wood flooring; Vinyl flooring; Ceramic tile
- Bathrooms: Two full bathrooms; One half bathroom; One full bath with tub and shower (second level); One half bath (first level); Primary bedroom has a bath
- Heating & cooling: Central air conditioning; Electric heating; Heat pump
- Interior features: Ceiling fans; Eat-in kitchen; Granite counters; Pantry; Recessed lighting; Cable TV available; Wired for data; High-speed internet available
- Laundry & utility: Washer hookup; Dryer hookup; Washer; Dryer; Electric water heater
Neighborhood map
What this means for you Summary
Snapshot
- This is a 3-bed/2.5-bath townhouse listed at $210k. Condition is rated good.
Deal economics
- At list price, monthly cash flow is $-57 ($-680/yr) — negative.
- To cash-flow at today's rent, offer at most $202k (3.9% below list).
- To meet the 1% rule (rent ≥ 1% of price), the offer needs to be $177k (15.9% below list).
- Recommended offer: $177k (15.9% below list) — sets the bar for 1% rule.
- Cap rate 6.0% vs local median 3.2% in Richmond — top-decile yield for the area; either an underpriced asset or a hidden risk that comps aren't pricing in. Stress-test before assuming the spread holds.
Location & tenants
- Location reads 84/100 on livability (#33 in VA, #793 nationally) — a professional / high-income tenant draw. Strengths: amenities A+, commute A+, health & safety A+; Watch: crime D-.
- Richmond City Public School District (urban): math 32% / reading 47% proficiency, ranked #123 of 131 in VA (top 94%) — families likely to look elsewhere, expect single-tenant / working-renter base with shorter leases; 74% free/reduced lunch — lower-income household profile, screen leases tightly.
- Zoned schools: Oak Grove/Bellemeade Elementary (math 12% / reading 27%, grade F, #1,089 of 1,108 statewide, top 99%, 594 students, 99% FRL); Thomas C. Boushall Middle (math 12% / reading 27%, grade F, #340 of 342 statewide, top 99%, 611 students, 98% FRL); Armstrong High (math 12% / reading 54%, grade F, #316 of 319 statewide, top 99%, 747 students, 90% FRL) — zoned schools average 96% FRL vs 74% district-wide (22 pts higher); higher-poverty schools than district average — tighter screening recommended.
- Zoned-school proficiency averages 24% at this address vs 40% district-wide (-15 pts) — the specific schools serving this property underperform the Richmond City Public School District average; the district grade overstates school quality for this exact location.
- Market conditions: Rents rising fast (+4.5%/yr); 177 active listings in the ZIP; 40 comparable units currently listed for rent nearby; rentals at typical pace (median 17d on market — plan ~3-4 weeks tenant-placement turnaround); 2,540 units permitted in Richmond city in 2024 (2,077 in 5+ unit buildings).
- This rent runs 42% of the median local income ($50k/yr) — at the standard rent-burdened threshold; future hikes will face affordability resistance.
Forward outlook
- Local home prices are declining (-3.0%/yr); year-one equity from $1k of loan paydown is wiped out by about $6k of value loss. Plan a longer hold.
- Richmond County population projected at +40% by 2050 — long-run rental-demand tailwind backs the buy-and-hold thesis.
Negotiation context
- It's been on market 19 days — a 2% lower offer ($207k) is reasonable based on typical stale-listing flexibility.
Questions for the listing agent
- What do current leases actually rent for vs. the listed asking? Can we see a recent rent roll and the last 12 months of T-12 income?
- Is there a deadline driving the sale (1031 exchange, divorce, estate, relocation)? That informs how much negotiation room exists.
- Schools are A-rated — typically a magnet for longer-tenancy family renters. What's the average tenant stay here, and is there a school-zone premium baked into asking?
- Crime grade is D in this area — have there been break-ins, vandalism, or insurance claims at this property in the last 3 years? What carrier currently insures it and at what premium?
- The area grade is low — what's the realistic commute time and amenity access for the typical tenant pool here? Any planned neighborhood developments (good or bad) we should know about?
- What's the average days-on-market for RENTAL listings here right now (not sales)? A rising rental-DOM trend means longer vacancies and softer asking-rent achievability than the comps imply.
- What's the recent tenant-quality profile in this submarket — average credit score on applications, eviction rate, late-payment / NSF rate, and stable-employment percentage? A property-management company in the area should have these aggregated.
- How much new for-sale + rental construction is in the pipeline within 1–3 miles? Heavy new supply typically softens prices + rents 12–24 months out; constrained supply supports both.
Investment metrics
- 1% rule
- 0.84% ✗
- Cap rate
- 5.97%
- Cash-on-cash
- -1.16%
- DSCR
- 0.95
- GRM
- 9.9
CMA / ARV
- ARV (on-the-fly)
- $190,070
- Comps found
- 1
Show comp detail 1 sale within ~0.75 mi
| Address | Dist | Beds/Ba | Sqft | Sold | Price | $/sf | Match |
|---|---|---|---|---|---|---|---|
| 2242 Ingram Ave | 0.00mi | 2/2.5 (-1) | 1,145 (0%) | 0mo | $190,000 | $166 | 95 |
Match score weights: distance 35% · size 25% · config 20% · recency 20%. Top-matched comps best support the ARV.
Projected returns pro-forma
-3.0% appreciation · 4.55% rent growth · sell at horizon
- IRR
- -16.5%
- Equity multiple
- 0.41×
- Total profit
- $-34,819
- Equity at exit
- $31,312
- IRR
- -5.7%
- Equity multiple
- 0.61×
- Total profit
- $-23,022
- Equity at exit
- $18,157
Cash invested: $58,800 (down + closing). Projections, not guarantees.
Landlord ↔ Tenant lean methodology
- Overall (STATE)
- 55 Moderately Landlord-Leaning
- State Virginia
- 55 Moderately Landlord-Leaning · D+2
- County
- — inherits STATE
- City
- — inherits STATE
ZIP-level market 23224
- Rents YoY
- 4.5%
- Active inventory
- 177
- Price-to-rent
- 9.9×
Monthly cashflow live
- Estimated rent
- $1,765 high interval (Pro) →
- Mortgage (P&I)
- −$1,101
- Tax est. 1.5%
- −$262 /mo · $3,150/yr
- Insurance
- −$88
- HOA
- −$0
- Vacancy / Maint / Mgmt
- −$371
- Net cashflow
- $-57
Break-even live
Sensitivity live
| Price | -10% $88 | -5% $16 | +0% $-57 | +5% $-129 | +10% $-202 |
|---|---|---|---|---|---|
| Rent | -10% $-196 | -5% $-126 | +0% $-57 | +5% $13 | +10% $83 |
| Rate | -1.0pp $49 | -0.5pp $-3 | base $-57 | +0.5pp $-111 | +1.0pp $-166 |
UW: 25.0% down · 7.5% · 30yr · 1.5% tax · 5.0% vac · 8.0% maint · 8.0% mgmt
Financing live
Cash to close
- Down payment
- $52,500
- Closing costs
- $6,300
- Reserves months
- —
- Total cash needed
- —
Loan-product check · same deal, 3 products live
Conventional
25% down · 7.5% · 30yr
- Down + closing
- —
- Monthly P&I
- —
- Monthly cashflow
- —
- DSCR
- —
- Eligible?
- —
Personal DTI + credit; lowest rate.
DSCR
20% down · 8.5% · 30yr
- Down + closing
- —
- Monthly P&I
- —
- Monthly cashflow
- —
- DSCR
- —
- Eligible?
- —
No personal income docs; deal must DSCR.
Hard money
10% down · 12.0% · 12mo
- Down + closing
- —
- Monthly P&I
- —
- Monthly cashflow
- —
- DSCR
- —
- Eligible?
- —
Short-term bridge; refi at stabilization.
Rent comps 40 comps
| Address | Beds | Baths | Sqft | Rent | $/sqft | DOM | Units | Dist |
|---|---|---|---|---|---|---|---|---|
| 2200 Ingram Ave Richmond, VA | 2.0 | 1.0–2.0 | 711 | $1,668 | $2.35 | 6d | 1 | 0.04mi |
| 2208 Keswick Ave Richmond, VA | 3.0 | 1.0 | 916 | $1,775 | $1.94 | 22d | 1 | 0.12mi |
| 1305 Chambers St Richmond, VA | 2.0 | 1.0 | 966 | $1,100 | $1.14 | 25d | 1 | 0.23mi |
| 1410 Enfield Ave Unit 1410 Richmond, VA | 3.0 | 1.0 | 912 | $1,500 | $1.64 | 45d | 1 | 0.29mi |
| 1100 Richmond Hwy Richmond, VA | 1.0–3.0 | 1.0–2.0 | 1062 | $2,345 | $2.21 | 3d | 16 | 0.29mi |
| 1808 Edwards Ave Richmond, VA | 3.0 | 2.0 | 1040 | $1,750 | $1.68 | 25d | 1 | 0.37mi |
| 800 Richmond Hwy Richmond, VA | 1.0–2.0 | 1.0–2.0 | 778 | $2,044 | $2.63 | 45d | 1 | 0.38mi |
| 1112 E 16th St Richmond, VA | 4.0 | 1.0 | 1206 | $1,595 | $1.32 | 45d | 1 | 0.42mi |
| 1913 Dinwiddie Ave Unit 1546196P Richmond, VA | 2.0 | 1.0 | 1044 | $2,519 | $2.41 | 16d | 1 | 0.43mi |
| 1801 Chicago Ave Richmond, VA | 2.0 | 1.0 | 850 | $995 | $1.17 | 25d | 1 | 0.53mi |
| 622 E 18th St Richmond, VA | 2.0 | 1.0 | 850 | $995 | $1.17 | 45d | 1 | 0.54mi |
| 1707 Chicago Ave Richmond, VA | 2.0 | 1.0 | 750 | $995 | $1.33 | 45d | 1 | 0.55mi |
| 2010 Maury St Richmond, VA | 2.0 | 1.0 | 883 | $1,675 | $1.90 | 6d | 1 | 0.61mi |
| 1125 Commerce Rd Richmond, VA | 1.0–2.0 | 1.0–1.5 | 685 | $1,409 | $2.06 | 5d | 5 | 0.75mi |
| 1709 Everett St Richmond, VA | 4.0 | 1.5 | 1460 | $1,995 | $1.37 | 45d | 1 | 0.76mi |
| 2100 Wright Ave Richmond, VA | 3.0 | 1.0 | 1014 | $1,695 | $1.67 | 3d | 1 | 0.83mi |
| 2200 Lynhaven Ave Richmond, VA | 1.0–2.0 | 1.0 | 785 | $1,230 | $1.57 | 6d | 2 | 0.87mi |
| 116 E 15th St Richmond, VA | 4.0 | 2.0 | 1452 | $2,250 | $1.55 | 25d | 1 | 0.89mi |
| 2146 Afton Ave Richmond, VA | 2.0 | 1.0 | 785 | $1,080 | $1.38 | 45d | 1 | 0.90mi |
| 10 W 27th St Unit P P Richmond, VA | 2.0 | 1.0 | 975 | $1,300 | $1.33 | 45d | 1 | 1.03mi |
| 1514 Bainbridge St Unit A Richmond, VA | 2.0 | 1.0 | 800 | $1,299 | $1.62 | 13d | 1 | 1.04mi |
| 1422 Bainbridge St Richmond, VA | 2.0 | 2.0 | 1121 | $2,399 | $2.14 | 4d | 1 | 1.06mi |
| 1021 E 4th St Richmond, VA | 1.0–2.0 | 1.0–2.0 | 759 | $1,449 | $1.91 | 3d | 87 | 1.06mi |
| 1912 Porter St Richmond, VA | 3.0 | 1.5 | 1415 | $1,950 | $1.38 | 25d | 1 | 1.07mi |
| 700 Everett St Richmond, VA | 1.0–2.0 | 1.0–2.0 | 809 | $1,849 | $2.28 | 6d | 14 | 1.09mi |
| 3154 Stockton St Richmond, VA | 3.0 | 1.0 | 1169 | $1,600 | $1.37 | 45d | 1 | 1.10mi |
| 201 Cowardin Ave Unit B Richmond, VA | 2.0 | 2.5 | 1436 | $2,200 | $1.53 | 45d | 1 | 1.13mi |
| 2522 Porter St Richmond, VA | 3.0 | 2.5 | 1390 | $1,800 | $1.29 | 45d | 1 | 1.14mi |
| 700 Stockton St Richmond, VA | 1.0–2.0 | 1.0 | 1035 | $1,805 | $1.74 | 3d | 31 | 1.14mi |
| 1207 Bainbridge St Richmond, VA | 2.0 | 2.0 | 937 | $2,250 | $2.40 | 13d | 1 | 1.17mi |
| 1203 Bainbridge St Apt A Richmond, VA | 2.0 | 2.0 | 927 | $1,495 | $1.61 | 45d | 1 | 1.17mi |
| 1411 Porter St Unit B Richmond, VA | 3.0 | 3.0 | 1500 | $2,145 | $1.43 | 6d | 1 | 1.17mi |
| 500 Maury St Richmond, VA | 2.0 | 1.0–2.0 | 665 | $2,295 | $3.45 | 5d | 17 | 1.18mi |
| 2503 Lynhaven Ave Richmond, VA | 2.0–3.0 | 1.0 | 750 | $1,600 | $2.13 | 3d | 2 | 1.19mi |
| 1212 Porter St Apt A Richmond, VA | 2.0 | 2.0 | 980 | $1,995 | $2.04 | 6d | 1 | 1.20mi |
| 500 Stockton St Richmond, VA | 1.0–2.0 | 1.0–2.0 | 748 | $1,346 | $1.80 | 5d | 16 | 1.23mi |
| 907 Bainbridge St Unit A Richmond, VA | 2.0 | 2.0 | 927 | $1,995 | $2.15 | 45d | 1 | 1.27mi |
| 616 Hull St Richmond, VA | 1.0–2.0 | 1.0–2.0 | 756 | $1,495 | $1.98 | 6d | 5 | 1.29mi |
| 1429 McDonough St Richmond, VA | 1.0–3.0 | 1.0–2.0 | 826 | $2,469 | $2.99 | 3d | 15 | 1.30mi |
| 501 Decatur St Richmond, VA | 1.0–2.0 | 1.0–2.0 | 668 | $1,849 | $2.77 | 3d | 7 | 1.32mi |
Listing history 12 events
-
2026-06-21days on market $210,000 Active 19 DOM
-
2026-06-18days on market $210,000 Active 16 DOM
-
2026-06-17days on market $210,000 Active 15 DOM
-
2026-06-16days on market $210,000 Active 14 DOM
-
2026-06-15days on market $210,000 Active 13 DOM
-
2026-06-13days on market $210,000 Active 11 DOM
-
2026-06-10days on market $210,000 Active 8 DOM
-
2026-06-09days on market $210,000 Active 7 DOM
-
2026-06-08days on market $210,000 Active 6 DOM
-
2026-06-07days on market $210,000 Active 5 DOM
-
2026-06-02remarks 688-char remark
-
2026-06-02$210,000 Active 1 DOM
ⓘ Source: listings_history table (triggers on properties + properties_extension) + one-shot
backfill from property_details.listing_events for pre-trigger history.
Nearby sold comps map
Loading sold comps map…
Walkable amenities ~0.75 mi
Loading nearby amenities…
Taxation est. · year 1
- Rental income
- $21,183
- − Mortgage interest
- −$11,763
- − Property taxes
- −$3,150
- − Insurance
- −$1,050
- − Repairs & maintenance
- −$1,695
- − Management
- −$1,695
- − Depreciation
- −$6,109
- Taxable loss
- −$4,279
- Est. tax savings @ 24.0%
- +$1,027
- After-tax cash flow
- $346/yr
For passive investors: Depreciation is non-cash, so a rental often shows a tax loss while cash-flowing — sheltering income. Rental losses are passive: they offset passive income freely, and up to $25,000/yr can offset ordinary (W-2) income if you actively participate and your MAGI is under $100k (phasing out to $0 by $150k); unused losses carry forward. On sale, claimed depreciation is recaptured at up to 25%, and gains may owe capital-gains tax (a 1031 exchange can defer both). Figures are a year-1 estimate at your 24.0% rate — not tax advice; consult a CPA.
Condition & rehab AI · 12 photos
This move-in ready townhome is in excellent condition with modern finishes and low-maintenance features. It offers a great opportunity for investors looking to capitalize on its prime location and attractive features.
Value-add opportunities
- Resale Painting interior walls — Fresh paint can enhance curb appeal and interior aesthetics
- Both Landscaping improvements — Enhances curb appeal and can increase property value
- Both Add smart home features — Can increase property value and attract tech-savvy buyers
Renovation cost estimate screening
Value-add ROI direction
- Resale Painting interior walls — Fresh paint can enhance curb appeal and interior aesthetics ↑
- Both Landscaping improvements — Enhances curb appeal and can increase property value ↑
- Both Add smart home features — Can increase property value and attract tech-savvy buyers ↑
ⓘ Cost ranges are severity-bucket heuristics (US national rule-of-thumb). Get contractor quotes + a written scope before underwriting a rehab budget.
Schools (NCES district)
- District
- Richmond City Public School District
- NCES district ID
- 5103240
- Math proficiency
- 32% ▼ -24.00%
- Reading proficiency
- 47% ▼ -9.00%
- Median HH income
- $40,276
- Composite
- 33.09/100
- National rank
- #5564
- State rank
- #123 of 131 in VA
Livability — Richmond
- Score
- 84/100
- State rank
- #33
- US rank
- #793
Category grades
Schools grade is shown separately in the Schools card above.
Census & demographics
- Census place
- Richmond, VA
- County
- Richmond City · 178,280 people
- City population
- 287,109
- Metro
- Richmond, VA
- Population (ZIP)
- 40,575
- Household income
- $50,475
- Rent vs Own
- Severe rent burden
- 3584.0
Population outlook (Richmond County) Hauer SSP2
- Today (2025)
- 262,263 people
- By 2030
- 284,503 · +8.5%
- By 2040
- 327,353 · +24.8%
- By 2050
- 367,946 · +40.3%
- By 2075
- 449,560 · +71.4%
- By 2100
- 500,301 · +90.8%
Race, ethnicity, and origin ACS 2023
- Neighborhood character
- Diverse neighborhood (Simpson 0.58)
- Race & ethnicity
- Black 59% Hispanic / Latino 22% White 15% Two or more races 6%
- Hispanic origin (detail)
- Mexican 5% Puerto Rican 2%
- Common ancestry
- Romanian 1% Lithuanian 1% Serbian 1%
- Foreign-born
- 17% · Canada
- Languages at home
- 78% English-only · Spanish 19% French/Haitian/Cajun 1%
Political lean MEDSL · Richmond
- 2024 margin
- Solid D (+66.3) · D 82.0% · R 15.8% · Other 2.2%
- 2008→2024 swing
- +7.2pp toward D · 2008: 59.1pp · 2024: 66.3pp
- All cycles
- 2024: D+66.3 2020: D+68.0 2016: D+63.8 2012: D+55.7 2008: D+59.1
Not yet ingested
- Civics
- —
Market trends
- HPI YoY
- ▼ -283.99%
- Current HPI
- 336.9345
- Rent YoY
- ▲ 4.55%
- Metro
- Richmond, VA
- State GDP YoY
- ▲ 2.40%
- F500 in state
- 50
Industry mix (Fortune 500 HQ in VA)
| Industry | F500 HQs | Revenue |
|---|---|---|
| Aerospace / Defense | 4 | $236B |
|
||
| Technology / Defense | 3 | $32B |
|
||
| Financial Services | 2 | $176B |
|
||
| Utilities | 2 | $27B |
|
||
| Insurance | 2 | $25B |
|
||
| Technology | 2 | $15B |
|
||
Price history
1 event — show timeline
- 2026-06-02 Listed $210,000 CVRMLS
Cash-flow waterfall
monthlySold comps — $/sqft
last 12 mo · ≤1 miLoading sold comps…