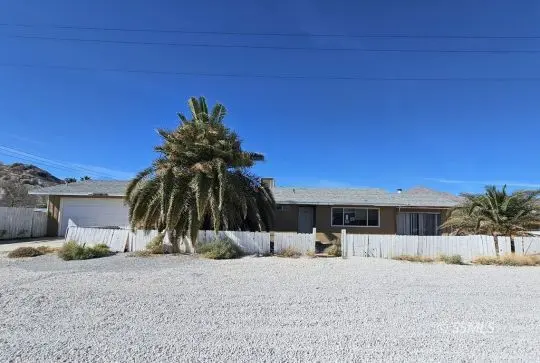
13759 Cedar St
Searles Valley, CA 93562
$69,900A-
3 bd · 2.0 ba ·
1,420 sqft ·
Built 1967
· SingleFamily
· Active
· 148 DOM
Cashflow @ list (25.0% down · 7.5%)
Estimated rent
$1,633/mo
Mortgage (P&I)
−$367
Tax + insurance
−$130
HOA
−$0
Vac / Maint / Mgmt
−$343
Net cashflow
$794/mo
Annual
$9,528/yr
Cap rate
19.92%
Cash-on-cash
48.68%
DSCR
3.17
1% rule
2.34%
Cash to close
$19,572
Investor read
- This is a 3-bed/2.0-bath single-family listed at $70k.
- At list price, monthly cash flow is $794 ($10k/yr) — positive.
- The deal already cash-flows at list — no discount required.
- Meets the 1% rule at list price ($2k rent vs $70k).
- It's been on market 148 days — a 12% lower offer ($62k) is reasonable based on typical stale-listing flexibility.
- Recommended offer: $62k (12.0% below list) — sets the bar for market timing.
- In year one you build about $3k of equity ($483 loan paydown + $2k appreciation (3.0% local appreciation)).
- Location reads 62/100 on livability (#500 in CA) — a middle-class / working-renter tenant base. Strengths: cost of living A+, housing A+, crime B; Watch: health & safety C-, schools F, amenities F.
- Trona Joint Unified (rural): math 25% / reading 40% proficiency, ranked #1,004 of 1,400 in CA (top 72%) — families likely to look elsewhere, expect single-tenant / working-renter base with shorter leases; 61% free/reduced lunch — lower-income household profile, screen leases tightly.
- Market conditions: 56 active listings in the ZIP; 5,458 units permitted in San Bernardino County in 2024 (1,500 in 5+ unit buildings).
- San Bernardino County population projected at +15% by 2050 — modest demand growth; plan on rents tracking national, not racing it.
- 2 sale attempts; this cycle's ask has dropped $28k (28%) from the opening price — seller is motivated, your offer sets the floor, not the list.
- At projected returns (3.0% appreciation + 3.0% rent growth), your $20k cash investment doubles in ~2 years — after that, you're playing with house money.
- Climate carrying-cost: extreme-heat days projected 7→17/yr by 2055 (HVAC capex compounding) — expect insurance premiums to compound above CPI over the hold.
- Cap rate 19.9% vs local median 10.4% in Searles Valley — top-decile yield for the area; either an underpriced asset or a hidden risk that comps aren't pricing in. Stress-test before assuming the spread holds.
Questions for listing agent
- It's been on market 148 days. Have you received any prior offers? Is the seller open to a 12% concession, seller financing, or rate buy-down credit?
- Built in 1967 — when were the roof, HVAC, electrical panel, plumbing, and water heater last replaced?
- Why hasn't it sold? Are there any deal-killer items the seller is aware of (foundation, flood, title, zoning, code violations)?
- Is there a deadline driving the sale (1031 exchange, divorce, estate, relocation)? That informs how much negotiation room exists.
- Schools are F-rated, which usually means shorter tenancies and higher turnover. Who's the typical renter profile here, and what's been the actual vacancy rate?
- What's the average days-on-market for RENTAL listings here right now (not sales)? A rising rental-DOM trend means longer vacancies and softer asking-rent achievability than the comps imply.
- What's the recent tenant-quality profile in this submarket — average credit score on applications, eviction rate, late-payment / NSF rate, and stable-employment percentage? A property-management company in the area should have these aggregated.
- How much new for-sale + rental construction is in the pipeline within 1–3 miles? Heavy new supply typically softens prices + rents 12–24 months out; constrained supply supports both.
CashFlowRE · CFR-EQ3WCZ2W20ASR4
· Data 2 days ago
cashflowre.app · 2026-05-29