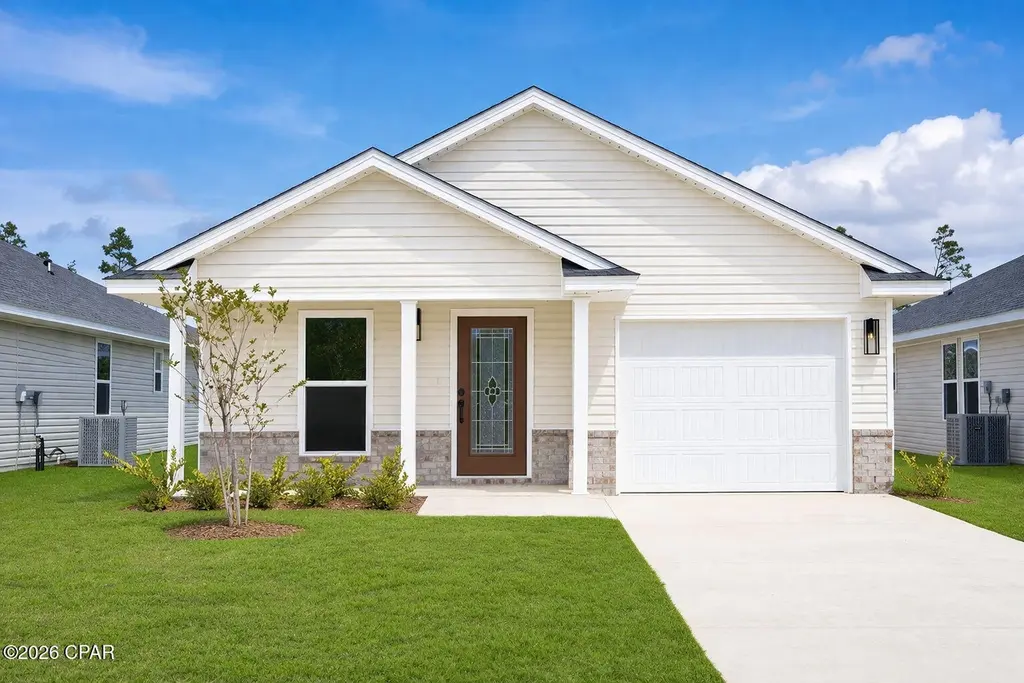
7153 Fox Meadow Dr
Callaway, FL 32404
$230,544D-
3 bd · 2.0 ba ·
1,365 sqft ·
Built 2025
· Land
· Pending
· 56 DOM
Cashflow @ list (25.0% down · 7.5%)
Estimated rent
$1,696/mo
Mortgage (P&I)
−$1,209
Tax + insurance
−$384
HOA
−$0
Vac / Maint / Mgmt
−$356
Net cashflow
$-254/mo
Annual
$-3,043/yr
Cap rate
4.97%
Cash-on-cash
-4.71%
DSCR
0.79
1% rule
0.74%
Cash to close
$64,552
Investor read
- This is a 3-bed/2.0-bath land listed at $231k.
- At list price, monthly cash flow is $-254 ($-3k/yr) — negative.
- To cash-flow at today's rent, offer at most $194k (15.9% below list).
- To meet the 1% rule (rent ≥ 1% of price), the offer needs to be $170k (26.4% below list).
- It's been on market 56 days — a 3% lower offer ($224k) is reasonable based on typical stale-listing flexibility.
- Recommended offer: $170k (26.4% below list) — sets the bar for 1% rule.
- Local home prices are declining (-3.0%/yr); year-one equity from $2k of loan paydown is wiped out by about $7k of value loss. Plan a longer hold.
- Location reads 64/100 on livability (#690 in FL) — a middle-class / working-renter tenant base. Strengths: cost of living A+, housing A+; Watch: employment D+, amenities F, commute F.
- Bay (suburban): math 51% / reading 51% proficiency, ranked #29 of 73 in FL (top 40%) — acceptable for families but not a draw, mixed tenant base, ~2y average lease.
- Zoned schools: Callaway Elementary School (math 37% / reading 42%, grade F, #1,513 of 2,144 statewide, top 73%, 511 students, 72% FRL); Rutherford High School (math 24% / reading 29%, grade F, #489 of 667 statewide, top 74%, 1,337 students, 63% FRL) — zoned schools average 68% FRL vs 48% district-wide (19 pts higher); higher-poverty schools than district average — tighter screening recommended.
- Zoned-school proficiency averages 33% at this address vs 51% district-wide (-18 pts) — the specific schools serving this property underperform the Bay average; the district grade overstates school quality for this exact location.
- Market conditions: Rents rising (+1.1%/yr); 983 active listings in the ZIP; 16 comparable units currently listed for rent nearby; rentals at typical pace (median 23d on market — plan ~3-4 weeks tenant-placement turnaround); 2,473 units permitted in Bay County in 2024 (559 in 5+ unit buildings).
- Bay County population projected at +24% by 2050 — long-run rental-demand tailwind backs the buy-and-hold thesis.
- Climate carrying-cost: severe wind risk, 99% chance of damaging wind over 30y; major wildfire risk; extreme-heat days projected 7→21/yr by 2055 (HVAC capex compounding) — expect insurance premiums to compound above CPI over the hold.
Questions for listing agent
- What do current leases actually rent for vs. the listed asking? Can we see a recent rent roll and the last 12 months of T-12 income?
- It's been on market 56 days. Have you received any prior offers? Is the seller open to a 26% concession, seller financing, or rate buy-down credit?
- Is there a deadline driving the sale (1031 exchange, divorce, estate, relocation)? That informs how much negotiation room exists.
- Schools are F-rated, which usually means shorter tenancies and higher turnover. Who's the typical renter profile here, and what's been the actual vacancy rate?
- The area grade is low — what's the realistic commute time and amenity access for the typical tenant pool here? Any planned neighborhood developments (good or bad) we should know about?
- What's the average days-on-market for RENTAL listings here right now (not sales)? A rising rental-DOM trend means longer vacancies and softer asking-rent achievability than the comps imply.
- What's the recent tenant-quality profile in this submarket — average credit score on applications, eviction rate, late-payment / NSF rate, and stable-employment percentage? A property-management company in the area should have these aggregated.
- How much new for-sale + rental construction is in the pipeline within 1–3 miles? Heavy new supply typically softens prices + rents 12–24 months out; constrained supply supports both.
CashFlowRE · CFR-EQJQPC2VVB8CSA
· Data 1 day ago
cashflowre.app · 2026-05-29