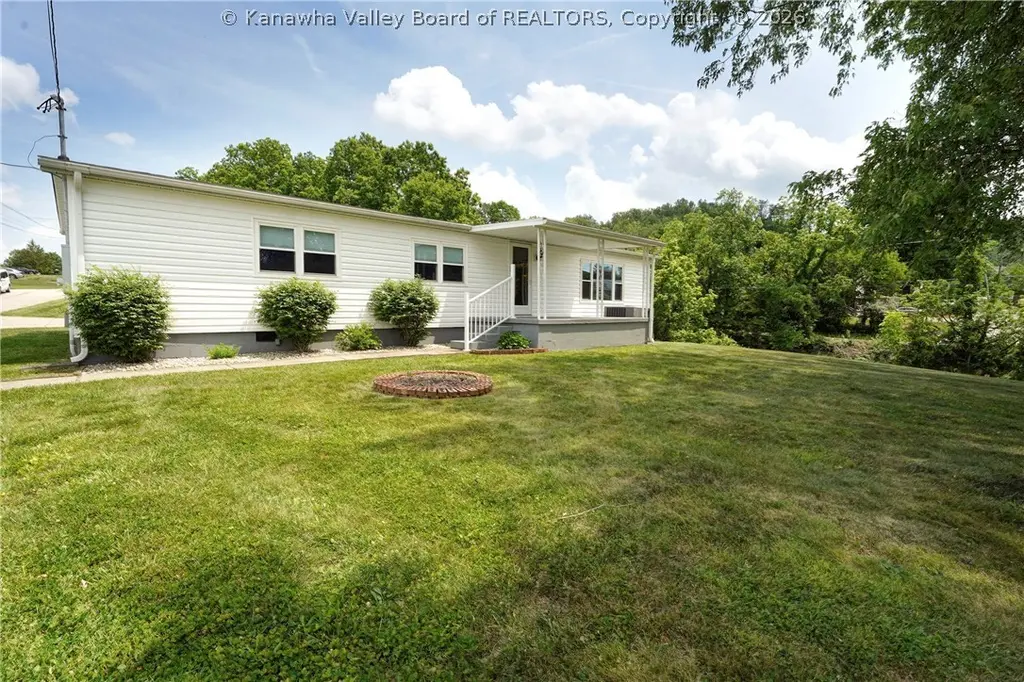
76 Precious Dr
Teays Valley, WV 25526
$164,900D
2 bd · 2.5 ba ·
1,248 sqft ·
Built 1972
· Manufactured
· Pending
· 5 DOM
Cashflow @ list (25.0% down · 7.5%)
Estimated rent
$1,256/mo
Mortgage (P&I)
−$865
Tax + insurance
−$112
HOA
−$0
Vac / Maint / Mgmt
−$264
Net cashflow
$16/mo
Annual
$187/yr
Cap rate
6.41%
Cash-on-cash
0.41%
DSCR
1.02
1% rule
0.76%
Cash to close
$46,172
Investor read
- This is a 2-bed/2.5-bath manufactured listed at $165k.
- At list price, monthly cash flow is $16 ($187/yr) — positive.
- The deal already cash-flows at list — no discount required.
- To meet the 1% rule (rent ≥ 1% of price), the offer needs to be $126k (23.8% below list).
- Only 5 days on market — expect competitive offers; lowballing is unlikely to land.
- Recommended offer: $126k (23.8% below list) — sets the bar for 1% rule.
- Local home prices are declining (-3.0%/yr); year-one equity from $1k of loan paydown is wiped out by about $5k of value loss. Plan a longer hold.
- Location reads 79/100 on livability (#17 in WV, #2,178 nationally) — a middle-class / working-renter tenant base. Strengths: crime A+, employment A+, housing A+; Watch: amenities F, commute F.
- Putnam County Schools (suburban): math 40% / reading 50% proficiency, ranked #2 of 55 in WV (top 4%) — families likely to look elsewhere, expect single-tenant / working-renter base with shorter leases.
- Zoned schools: Mountain View Elementary School (math 42% / reading 47%, grade F, #71 of 377 statewide, top 22%, 478 students, 0% FRL); Hurricane Middle (math 44% / reading 50%, grade D+, #6 of 109 statewide, top 6%, 849 students, 0% FRL); Hurricane High School (math 38% / reading 62%, grade D+, #6 of 110 statewide, top 5%, 1,256 students, 0% FRL) — zoned schools average 0% FRL vs 33% district-wide (33 pts lower); this property's tenant base skews higher-income than the district average.
- Market conditions: 119 active listings in the ZIP; solid renter incomes; 111 units permitted in Putnam County in 2024 (0 in 5+ unit buildings).
- Climate carrying-cost: extreme-heat days projected 7→19/yr by 2055 (HVAC capex compounding) — expect insurance premiums to compound above CPI over the hold.
- Cap rate 6.4% vs local median 2.5% in Teays Valley — top-decile yield for the area; either an underpriced asset or a hidden risk that comps aren't pricing in. Stress-test before assuming the spread holds.
- This rent is only 18% of the median local income ($85k/yr) — well below the 30% rent-burden line; pricing power to push rent on renewal without tenant pushback.
Questions for listing agent
- Built in 1972 — when were the roof, HVAC, electrical panel, plumbing, and water heater last replaced?
- Is there a deadline driving the sale (1031 exchange, divorce, estate, relocation)? That informs how much negotiation room exists.
- Schools are D-rated, which usually means shorter tenancies and higher turnover. Who's the typical renter profile here, and what's been the actual vacancy rate?
- The area grade is low — what's the realistic commute time and amenity access for the typical tenant pool here? Any planned neighborhood developments (good or bad) we should know about?
- What's the average days-on-market for RENTAL listings here right now (not sales)? A rising rental-DOM trend means longer vacancies and softer asking-rent achievability than the comps imply.
- What's the recent tenant-quality profile in this submarket — average credit score on applications, eviction rate, late-payment / NSF rate, and stable-employment percentage? A property-management company in the area should have these aggregated.
- How much new for-sale + rental construction is in the pipeline within 1–3 miles? Heavy new supply typically softens prices + rents 12–24 months out; constrained supply supports both.
CashFlowRE · CFR-ER7EEG73TAKRAD
· Data 3 weeks ago
cashflowre.app · 2026-05-29