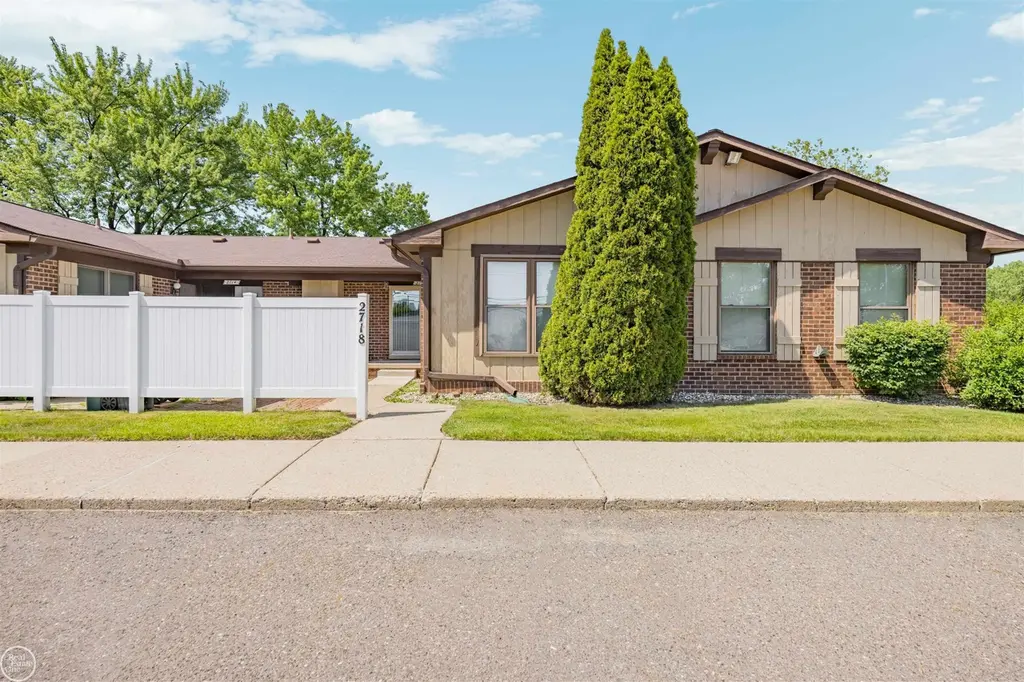
2718 Roundtree Dr
Troy, MI 48083
$219,000D+
3 bd · 1.0 ba ·
1,582 sqft ·
Built 1973
· Condo
· Active
· 13 DOM
Cashflow @ list (25.0% down · 7.5%)
Estimated rent
$2,292/mo
Mortgage (P&I)
−$1,148
Tax + insurance
−$209
HOA
−$406
Vac / Maint / Mgmt
−$481
Net cashflow
$48/mo
Annual
$572/yr
Cap rate
6.55%
Cash-on-cash
0.93%
DSCR
1.04
1% rule
1.05%
Cash to close
$61,320
Investor read
- This is a 3-bed/1.0-bath condo listed at $219k.
- At list price, monthly cash flow is $48 ($572/yr) — positive.
- The deal already cash-flows at list — no discount required.
- Meets the 1% rule at list price ($2k rent vs $219k).
- Only 13 days on market — expect competitive offers; lowballing is unlikely to land.
- Local home prices are declining (-3.0%/yr); year-one equity from $2k of loan paydown is wiped out by about $7k of value loss. Plan a longer hold.
- Location reads 78/100 on livability (#113 in MI, #2,684 nationally) — a middle-class / working-renter tenant base. Strengths: employment A+, housing A+, schools A; Watch: health & safety D+, amenities F, commute F.
- Troy School District (urban): math 68% / reading 75% proficiency, ranked #8 of 540 in MI (top 2%) — strong family-tenant draw, lease renewals of 3-5y typical; only 10% free/reduced lunch — higher-income household profile.
- Market conditions: Rents soft (-0.6%/yr); 91 active listings in the ZIP; 15 comparable units currently listed for rent nearby; rentals at typical pace (median 15d on market — plan ~3-4 weeks tenant-placement turnaround); solid renter incomes; 2,614 units permitted in Oakland County in 2024 (721 in 5+ unit buildings).
- Oakland County population projected at +10% by 2050 — modest demand growth; plan on rents tracking national, not racing it.
- 5 sale attempts since 27y ago with the ask held roughly flat each time — persistent listings suggest the price (not the market) is what's stuck; bring a comps-based counter.
- Current owner paid $132k; list at $219k implies a 66% gain — meaningful room to come down on a strong offer.
- Cap rate 6.6% vs local median 3.6% in Troy — top-decile yield for the area; either an underpriced asset or a hidden risk that comps aren't pricing in. Stress-test before assuming the spread holds.
- This rent runs 30% of the median local income ($91k/yr) — at the standard rent-burdened threshold; future hikes will face affordability resistance.
Questions for listing agent
- Built in 1973 — when were the roof, HVAC, electrical panel, plumbing, and water heater last replaced?
- What does the HOA fee cover, when was the last increase, and are there any pending special assessments or reserve-fund shortfalls?
- Any open or pending special assessments — roof, HVAC, plumbing, elevator, façade? What's the per-unit balance and payoff schedule, and is the seller paying it off at close or rolling it to the buyer?
- Is there a deadline driving the sale (1031 exchange, divorce, estate, relocation)? That informs how much negotiation room exists.
- Schools are A-rated — typically a magnet for longer-tenancy family renters. What's the average tenant stay here, and is there a school-zone premium baked into asking?
- The area grade is low — what's the realistic commute time and amenity access for the typical tenant pool here? Any planned neighborhood developments (good or bad) we should know about?
- What's the average days-on-market for RENTAL listings here right now (not sales)? A rising rental-DOM trend means longer vacancies and softer asking-rent achievability than the comps imply.
- What's the recent tenant-quality profile in this submarket — average credit score on applications, eviction rate, late-payment / NSF rate, and stable-employment percentage? A property-management company in the area should have these aggregated.
CashFlowRE · CFR-ERXKNJ0FPC75RN
· Data 2 days ago
cashflowre.app · 2026-05-29