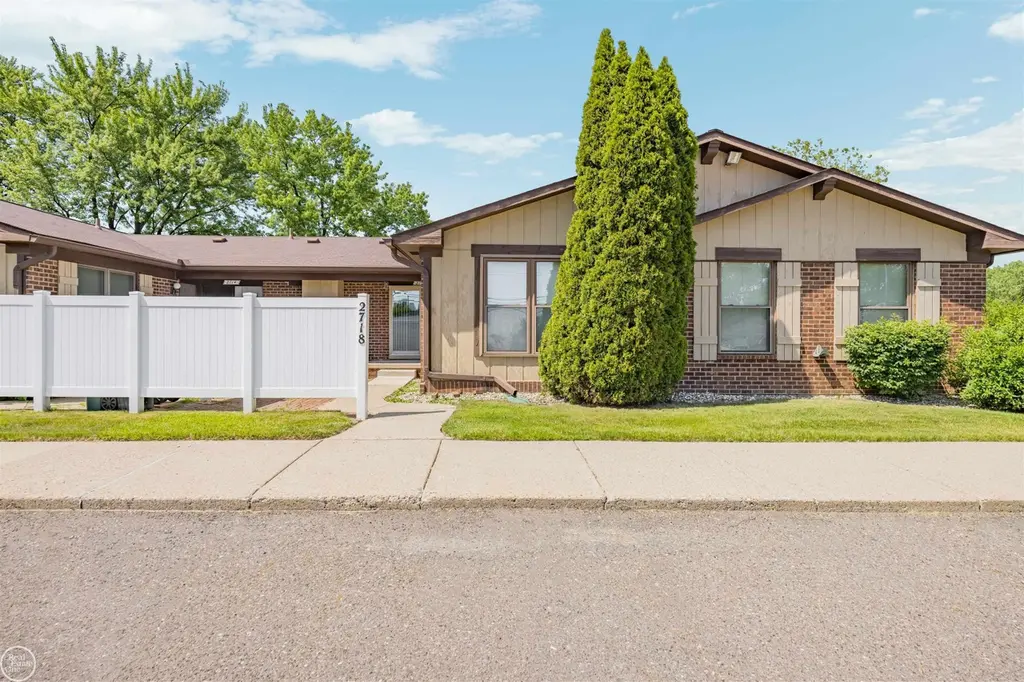
2718 Roundtree Dr · Troy, MI
Flood risk 3/10 · Minor
- FEMA flood zone
- X (unshaded)
- Chance of flooding over 30 yrs
- 0.2%
- Est. flood insurance / yr
- $473 – $860
Fire risk 1/10 · Minimal
- Est. fire insurance / yr
- $784 – $1,456
Heat risk 3/10 · Minor
- Hot days now (above 97°F)
- 7 days/yr
- Hot days in 30 yrs
- 15 days/yr
Wind risk 2/10 · Minimal
- Chance of severe wind over 30 yrs
- —
Air-quality risk 3/10 · Minor
- Unhealthy air days now
- 3 days/yr
- Unhealthy air days in 30 yrs
- 4 days/yr
Risk factors via First Street. Map © Google.
Why this score? — see what drove the D+ grade
The composite is a weighted blend of 9 inputs, each scored 0–100. Each bar is that input's sub-score; the figure is the points it added to the 100-point composite (weight × sub-score).
- Cash flow +14.5/30.0
- ARV discount +7.5/15.0
- Schools +6.5/10.0
- 1% rule +5.5/10.0
- DSCR +4.4/10.0
- Livability +3.9/5.0
- Condition / age +2.5/5.0
- Rent growth +2.3/5.0
- Appreciation +0.0/10.0
$219,000
🖨 Deal sheet 📄 Offer letter ✓ Due diligence
Listing remarks MLS
Welcome home to this beautifully updated condo in an unbeatable Troy location! Conveniently situated near expressways, shopping, dining, and vibrant downtown Troy, this home offers both comfort and convenience. The spacious living room provides plenty of room to relax and entertain, while the generous dining area easily accommodates a large table for gatherings. The updated kitchen features newer cabinetry and finishes, complemented by newer flooring throughout much of the home. Offering three bedrooms and two full baths, there is plenty of space for guests, or a home office. The basement has been partially finished by the seller and is ready for your finishing touches, providing an excellent opportunity to add additional living space and build instant equity. All appliances are included, making this home truly move-in ready. Don't miss this fantastic opportunity—keys at closing!
Key facts
- Newer flooring
- Updated condo
- Newer cabinetry
Tags
Property features AI
Finance
- HOA & community: Homeowners association with monthly fee of $406; Community pool
Exterior
- Parking: Carport
- Utilities: Public water; Public sewer
- Home design: Condominium (residential); One level
- Construction: Brick construction
- Exterior features: Patio; Community pool; Pets allowed (cats and dogs; number limit)
Interior
- Kitchen: Oven; Range; Refrigerator
- Bedrooms: 7 total rooms (includes bedrooms and living spaces)
- Bathrooms: 2 full bathrooms
- Heating & cooling: Forced air heating (natural gas); Central air conditioning
- Interior features: Finished basement; Gas water heater; Oven; Range; Refrigerator
- Laundry & utility: Gas water heater
Neighborhood map
What this means for you Summary
Snapshot
- This is a 3-bed/1.0-bath condo listed at $219k.
Deal economics
- At list price, monthly cash flow is $48 ($572/yr) — positive.
- The deal already cash-flows at list — no discount required.
- Meets the 1% rule at list price ($2k rent vs $219k).
- Cap rate 6.6% vs local median 3.6% in Troy — top-decile yield for the area; either an underpriced asset or a hidden risk that comps aren't pricing in. Stress-test before assuming the spread holds.
Location & tenants
- Location reads 78/100 on livability (#113 in MI, #2,684 nationally) — a middle-class / working-renter tenant base. Strengths: employment A+, housing A+, schools A; Watch: health & safety D+, amenities F, commute F.
- Troy School District (urban): math 68% / reading 75% proficiency, ranked #8 of 540 in MI (top 2%) — strong family-tenant draw, lease renewals of 3-5y typical; only 10% free/reduced lunch — higher-income household profile.
- Market conditions: Rents soft (-0.6%/yr); 91 active listings in the ZIP; 15 comparable units currently listed for rent nearby; rentals at typical pace (median 15d on market — plan ~3-4 weeks tenant-placement turnaround); solid renter incomes; 2,614 units permitted in Oakland County in 2024 (721 in 5+ unit buildings).
- This rent runs 30% of the median local income ($91k/yr) — at the standard rent-burdened threshold; future hikes will face affordability resistance.
Forward outlook
- Local home prices are declining (-3.0%/yr); year-one equity from $2k of loan paydown is wiped out by about $7k of value loss. Plan a longer hold.
- Oakland County population projected at +10% by 2050 — modest demand growth; plan on rents tracking national, not racing it.
Negotiation context
- Only 13 days on market — expect competitive offers; lowballing is unlikely to land.
- 5 sale attempts since 27y ago with the ask held roughly flat each time — persistent listings suggest the price (not the market) is what's stuck; bring a comps-based counter.
- Current owner paid $132k; list at $219k implies a 66% gain — meaningful room to come down on a strong offer.
Questions for the listing agent
- Built in 1973 — when were the roof, HVAC, electrical panel, plumbing, and water heater last replaced?
- What does the HOA fee cover, when was the last increase, and are there any pending special assessments or reserve-fund shortfalls?
- Any open or pending special assessments — roof, HVAC, plumbing, elevator, façade? What's the per-unit balance and payoff schedule, and is the seller paying it off at close or rolling it to the buyer?
- Is there a deadline driving the sale (1031 exchange, divorce, estate, relocation)? That informs how much negotiation room exists.
- Schools are A-rated — typically a magnet for longer-tenancy family renters. What's the average tenant stay here, and is there a school-zone premium baked into asking?
- The area grade is low — what's the realistic commute time and amenity access for the typical tenant pool here? Any planned neighborhood developments (good or bad) we should know about?
- What's the average days-on-market for RENTAL listings here right now (not sales)? A rising rental-DOM trend means longer vacancies and softer asking-rent achievability than the comps imply.
- What's the recent tenant-quality profile in this submarket — average credit score on applications, eviction rate, late-payment / NSF rate, and stable-employment percentage? A property-management company in the area should have these aggregated.
- How much new apartment / multifamily construction is in the pipeline within 1–3 miles? Heavy new supply (>2% of stock underway) typically softens rents 12–24 months out; light construction supports rent growth.
Investment metrics
- 1% rule
- 1.05% ✓
- Cap rate
- 6.55%
- Cash-on-cash
- 0.93%
- DSCR
- 1.04
- GRM
- 8.0
CMA / ARV
No comps found within radius.
Projected returns pro-forma
-3.0% appreciation · 0.0% rent growth · sell at horizon
- IRR
- -18.7%
- Equity multiple
- 0.36×
- Total profit
- $-38,980
- Equity at exit
- $32,654
- IRR
- -20.4%
- Equity multiple
- 0.10×
- Total profit
- $-55,229
- Equity at exit
- $18,935
Cash invested: $61,320 (down + closing). Projections, not guarantees.
Landlord ↔ Tenant lean methodology
- Overall (STATE)
- 62 Landlord-Friendly
- State Michigan
- 62 Landlord-Friendly · EVEN
- County
- — inherits STATE
- City
- — inherits STATE
ZIP-level market 48083
- Rents YoY
- -0.6%
- Active inventory
- 91
- Price-to-rent
- 8.0×
Monthly cashflow live
- Estimated rent
- $2,292 high interval (Pro) →
- Mortgage (P&I)
- −$1,148
- Tax from tax record
- −$117 /mo · $1,408/yr
- Insurance
- −$91
- HOA
- −$406
- Vacancy / Maint / Mgmt
- −$481
- Net cashflow
- $48
Break-even live
UW: 25.0% down · 7.5% · 30yr · 1.5% tax · 5.0% vac · 8.0% maint · 8.0% mgmt
Financing live
Cash to close
- Down payment
- $54,750
- Closing costs
- $6,570
- Reserves months
- —
- Total cash needed
- —
Loan-product check · same deal, 3 products live
Conventional
25% down · 7.5% · 30yr
- Down + closing
- —
- Monthly P&I
- —
- Monthly cashflow
- —
- DSCR
- —
- Eligible?
- —
Personal DTI + credit; lowest rate.
DSCR
20% down · 8.5% · 30yr
- Down + closing
- —
- Monthly P&I
- —
- Monthly cashflow
- —
- DSCR
- —
- Eligible?
- —
No personal income docs; deal must DSCR.
Hard money
10% down · 12.0% · 12mo
- Down + closing
- —
- Monthly P&I
- —
- Monthly cashflow
- —
- DSCR
- —
- Eligible?
- —
Short-term bridge; refi at stabilization.
Rent comps 15 comps
| Address | Beds | Baths | Sqft | Rent | $/sqft | DOM | Units | Dist |
|---|---|---|---|---|---|---|---|---|
| 2081 Newburgh Dr Troy, MI | 3.0 | 2.0 | 1500 | $2,300 | $1.53 | 43d | 1 | 0.40mi |
| 2226 Orpington Dr Troy, MI | 3.0 | 2.0 | 1421 | $2,495 | $1.76 | 10d | 1 | 0.42mi |
| 2497 Avalon Dr Troy, MI | 3.0 | 2.0 | 1400 | $2,500 | $1.79 | 10d | 1 | 0.63mi |
| 3043 Heritage Dr Troy, MI | 3.0 | 1.0 | 1250 | $2,100 | $1.68 | 44d | 1 | 0.67mi |
| 34800 Moravian Dr Sterling Heights, MI | 1.0–2.0 | 1.0–1.5 | 850 | $1,655 | $1.95 | 2d | 22 | 0.98mi |
| 36200 Dequindre Rd Sterling Heights, MI | 1.0–2.0 | 1.0–2.0 | 875 | $1,740 | $1.99 | 1d | 46 | 1.02mi |
| 1147 Beaver Run Troy, MI | 2.0 | 2.0 | 1444 | $2,100 | $1.45 | 24d | 1 | 1.07mi |
| 1156 Faulkner Troy, MI | 3.0 | 2.0 | 1156 | $2,000 | $1.73 | 43d | 1 | 1.07mi |
| 3072 Schoolhouse Unit Labs Troy, MI | 2.0 | 2.0 | 1534 | $2,300 | $1.50 | 43d | 1 | 1.07mi |
| 2233 Kettle Dr Troy, MI | 3.0 | 1.5 | 2097 | $2,500 | $1.19 | 24d | 1 | 1.08mi |
| 1097 Foxboro Troy, MI | 3.0 | 2.0 | 1534 | $2,500 | $1.63 | 1d | 1 | 1.11mi |
| 36511 Park Place Dr Sterling Heights, MI | 2.0 | 2.5 | 1350 | $2,000 | $1.48 | 14d | 1 | 1.27mi |
| 4033 Ramblewood Dr Troy, MI | 4.0 | 2.5 | 1906 | $2,859 | $1.50 | 43d | 1 | 1.29mi |
| 1115 Birchwood Ave Troy, MI | 3.0 | 2.5 | 1590 | $2,500 | $1.57 | 1d | 1 | 1.40mi |
| 710 Hartland Dr Troy, MI | 3.0 | 2.0 | 1760 | $2,875 | $1.63 | 5d | 1 | 1.49mi |
HOA detail condo
- Monthly dues
- $406 · $4,872/yr
- Assessments
- None detected in remarks — confirm with the listing agent.
Listing history 10 events
-
2026-06-18days on market $219,000 Active 13 DOM
-
2026-06-17days on market $219,000 Active 12 DOM
-
2026-06-16days on market $219,000 Active 11 DOM
-
2026-06-15days on market $219,000 Active 10 DOM
-
2026-06-13days on market $219,000 Active 8 DOM
-
2026-06-13days on market $219,000 Active 7 DOM
-
2026-06-09days on market $219,000 Active 4 DOM
-
2026-06-08days on market $219,000 Active 3 DOM
-
2026-06-07remarks 699-char remark
-
2026-06-07$219,000 Active 2 DOM
ⓘ Source: listings_history table (triggers on properties + properties_extension) + one-shot
backfill from property_details.listing_events for pre-trigger history.
Tax reassessment forecast MI · Partial reset (capped growth)
- Current annual tax
- $1,408 · $117/mo
- Projected year-2 tax
- $2,390 · $199/mo
- Expected delta
- +$982/yr (+$82/mo · 69.7%)
ⓘ Screening estimate from a state-policy table — verify with the county assessor before closing.
Climate risk First Street
- Flood 3/10 Moderate FEMA zone X (unshaded) · 20% chance over 30 yrs
- Wildfire 1/10 Low
- Heat 3/10 Moderate 7 d/yr ≥97°F today · 15 d/yr by 30 yrs out
- Wind 2/10 Low
- Air quality 3/10 Moderate 3 unhealthy d/yr today · 4 by 30 yrs out
Nearby sold comps map
Loading sold comps map…
Walkable amenities ~0.75 mi
Loading nearby amenities…
Taxation est. · year 1
- Rental income
- $27,505
- − Mortgage interest
- −$12,267
- − Property taxes
- −$1,408
- − Insurance
- −$1,095
- − Repairs & maintenance
- −$2,200
- − Management
- −$2,200
- − HOA
- −$4,872
- − Depreciation
- −$6,371
- Taxable loss
- −$2,909
- Est. tax savings @ 24.0%
- +$698
- After-tax cash flow
- $1,270/yr
For passive investors: Depreciation is non-cash, so a rental often shows a tax loss while cash-flowing — sheltering income. Rental losses are passive: they offset passive income freely, and up to $25,000/yr can offset ordinary (W-2) income if you actively participate and your MAGI is under $100k (phasing out to $0 by $150k); unused losses carry forward. On sale, claimed depreciation is recaptured at up to 25%, and gains may owe capital-gains tax (a 1031 exchange can defer both). Figures are a year-1 estimate at your 24.0% rate — not tax advice; consult a CPA.
Schools (NCES district)
- District
- Troy School District
- NCES district ID
- 2634260
- Math proficiency
- 68% ▼ -3.00%
- Reading proficiency
- 75% ▼ -2.00%
- Median HH income
- $90,920
- Composite
- 64.5/100
- National rank
- #539
- State rank
- #8 of 540 in MI
Livability — Troy
- Score
- 78/100
- State rank
- #113
- US rank
- #2684
Category grades
Schools grade is shown separately in the Schools card above.
Census & demographics
- Census place
- Troy, MI
- County
- Oakland County · 1,009,092 people
- City population
- 87,898
- Metro
- Detroit-Warren-Dearborn, MI
- Population (ZIP)
- 23,771
- Household income
- $90,794
- Rent vs Own
- Severe rent burden
- 511.0
Population outlook (Oakland County) Hauer SSP2
- Today (2025)
- 1,335,747 people
- By 2030
- 1,375,100 · +2.9%
- By 2040
- 1,435,385 · +7.5%
- By 2050
- 1,469,250 · +10.0%
- By 2075
- 1,531,946 · +14.7%
- By 2100
- 1,450,485 · +8.6%
Race, ethnicity, and origin ACS 2023
- Neighborhood character
- Majority White (64%)
- Race & ethnicity
- White 64% Asian 23% Two or more races 5% Black 4% Hispanic / Latino 3%
- Common ancestry
- Romanian 7% Lithuanian 6% Arab 3%
- Foreign-born
- 31% · China, Canada, South Korea
- Languages at home
- 67% English-only · Other Indo-European 10% Other Asian/Pacific 6% Arabic 5%
Political lean MEDSL · Oakland
- 2024 margin
- D (+10.6) · D 54.4% · R 43.8% · Other 1.9%
- 2008→2024 swing
- -3.9pp toward R · 2008: 14.5pp · 2024: 10.6pp
- All cycles
- 2024: D+10.6 2020: D+14.1 2016: D+8.1 2012: D+8.1 2008: D+14.5
Not yet ingested
- Civics
- —
Market trends
- HPI YoY
- ▼ -351.17%
- Current HPI
- 175.8232
- Rent YoY
- ▼ -0.62%
- Metro
- Detroit-Warren-Dearborn, MI
- State GDP YoY
- ▲ 1.37%
- F500 in state
- 28
Industry mix (Fortune 500 HQ in MI)
| Industry | F500 HQs | Revenue |
|---|---|---|
| Automotive Parts | 3 | $48B |
|
||
| Automotive | 2 | $372B |
|
||
| Chemicals | 1 | $45B |
|
||
| Automotive Retail | 1 | $29B |
|
||
| Healthcare / Medical Devices | 1 | $23B |
|
||
| Automotive Technology | 1 | $20B |
|
||
Price history
+271.2% since first listed16 events — show timeline
- 2026-06-05 Listed $219,000 REALCOMP
- 2026-06-05 Listed $219,000 MiRealSource-MiMLS
- 2007-04-23 Sold (Public Records) $132,000 Public Records
- 2007-04-16 Sold (MLS) $132,000 MiRealSource-MiMLS
- 2007-04-05 Listing Removed — MiRealSource-MiMLS
- 2006-12-09 Listed $130,000 MiRealSource-MiMLS
- 2002-12-04 Sold (Public Records) $133,500 Public Records
- 2002-08-27 Sold (MLS) $133,500 MiRealSource-MiMLS
- 2002-08-02 Listing Removed — MiRealSource-MiMLS
- 2002-07-15 Listed $137,900 MiRealSource-MiMLS
- 2001-06-19 Sold (Public Records) $120,000 Public Records
- 1999-11-01 Sold (Public Records) $112,500 Public Records
- 1999-08-27 Sold (MLS) $112,500 MiRealSource-MiMLS
- 1999-08-04 Listing Removed — MiRealSource-MiMLS
- 1999-07-19 Listed $113,900 MiRealSource-MiMLS
- 1985-09-01 Sold (Public Records) $59,000 Public Records
Property tax history
+2.1%/yrLatest (2025): $1,408 · +2.3% YoY. Source: county tax records.
Cash-flow waterfall
monthlySold comps — $/sqft
last 12 mo · ≤1 miLoading sold comps…