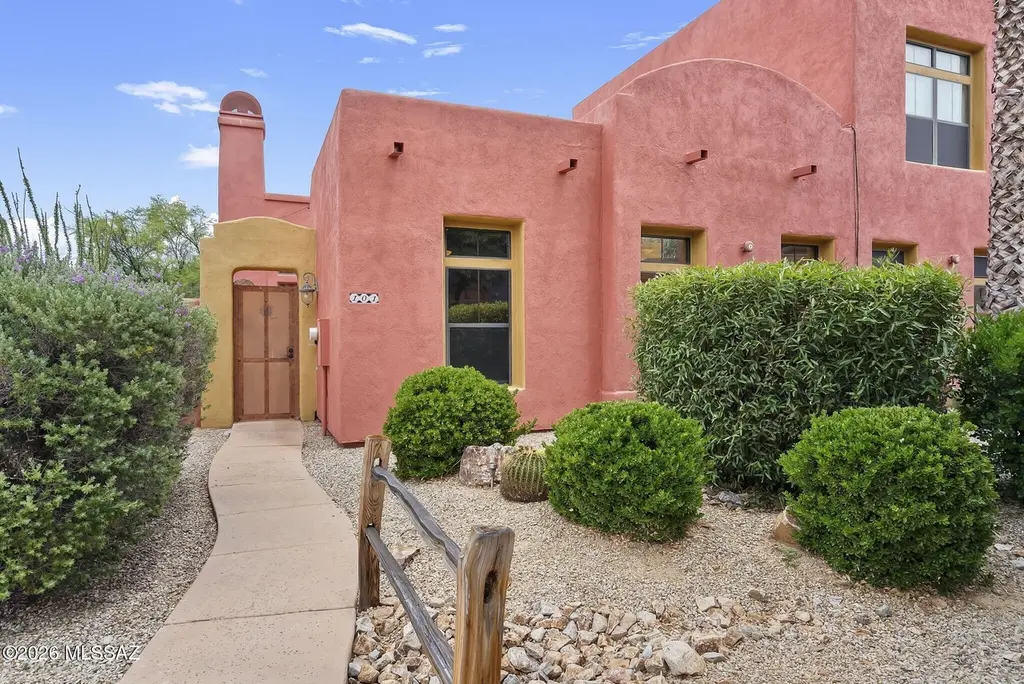
101 Post Way
Tubac, AZ 85646
$245,000D
1 bd · 2.0 ba ·
1,047 sqft ·
Built 2006
· Townhouse
· Active
· 20 DOM
Cashflow @ list (25.0% down · 7.5%)
Estimated rent
$2,275/mo
Mortgage (P&I)
−$1,285
Tax + insurance
−$266
HOA
−$299
Vac / Maint / Mgmt
−$478
Net cashflow
$-52/mo
Annual
$-624/yr
Cap rate
6.04%
Cash-on-cash
-0.91%
DSCR
0.96
1% rule
0.93%
Cash to close
$68,600
Investor read
- This is a 1-bed/2.0-bath townhouse listed at $245k.
- At list price, monthly cash flow is $-52 ($-624/yr) — negative.
- To cash-flow at today's rent, offer at most $236k (3.8% below list).
- To meet the 1% rule (rent ≥ 1% of price), the offer needs to be $228k (7.1% below list).
- It's been on market 20 days — a 2% lower offer ($241k) is reasonable based on typical stale-listing flexibility.
- Recommended offer: $228k (7.1% below list) — sets the bar for 1% rule.
- In year one you build about $1k of equity ($2k loan paydown + $-348 appreciation (-0.1% local appreciation)).
- Location reads 67/100 on livability (#60 in AZ) — a middle-class / working-renter tenant base. Strengths: crime A+, employment A, housing A; Watch: health & safety C-, amenities F, commute F.
- Santa Cruz Valley Unified District (4458) (town): math 12% / reading 26% proficiency, ranked #184 of 249 in AZ (top 74%) — low school quality limits family demand, transient renter base, plan for 1-2y turnover; 62% free/reduced lunch — lower-income household profile, screen leases tightly.
- Zoned schools: San Cayetano Elementary School (math 2% / reading 32%, grade F, #810 of 1,109 statewide, top 73%, 393 students, 69% FRL); Coatimundi Middle School (math 16% / reading 32%, grade F, #109 of 218 statewide, top 51%, 473 students, 69% FRL); Rio Rico High School (math 13% / reading 21%, grade F, #252 of 381 statewide, top 67%, 1,414 students, 72% FRL).
- Market conditions: 156 active listings in the ZIP; 340 units permitted in Santa Cruz County in 2024 (0 in 5+ unit buildings).
- Santa Cruz County population projected at -22% by 2050 — secular population decline; favor cash flow + early exit over multi-decade hold.
- 10 sale attempts since 18y ago with the ask held roughly flat each time — persistent listings suggest the price (not the market) is what's stuck; bring a comps-based counter.
- Climate carrying-cost: major wildfire risk; extreme-heat days projected 7→19/yr by 2055 (HVAC capex compounding) — expect insurance premiums to compound above CPI over the hold.
- Cap rate 6.0% vs local median 3.5% in Tubac — top-decile yield for the area; either an underpriced asset or a hidden risk that comps aren't pricing in. Stress-test before assuming the spread holds.
Questions for listing agent
- What do current leases actually rent for vs. the listed asking? Can we see a recent rent roll and the last 12 months of T-12 income?
- What does the HOA fee cover, when was the last increase, and are there any pending special assessments or reserve-fund shortfalls?
- Is there a deadline driving the sale (1031 exchange, divorce, estate, relocation)? That informs how much negotiation room exists.
- The area grade is low — what's the realistic commute time and amenity access for the typical tenant pool here? Any planned neighborhood developments (good or bad) we should know about?
- What's the average days-on-market for RENTAL listings here right now (not sales)? A rising rental-DOM trend means longer vacancies and softer asking-rent achievability than the comps imply.
- What's the recent tenant-quality profile in this submarket — average credit score on applications, eviction rate, late-payment / NSF rate, and stable-employment percentage? A property-management company in the area should have these aggregated.
- How much new for-sale + rental construction is in the pipeline within 1–3 miles? Heavy new supply typically softens prices + rents 12–24 months out; constrained supply supports both.
CashFlowRE · CFR-ES8ZPV4XF945CS
· Data 3 h ago
cashflowre.app · 2026-05-29