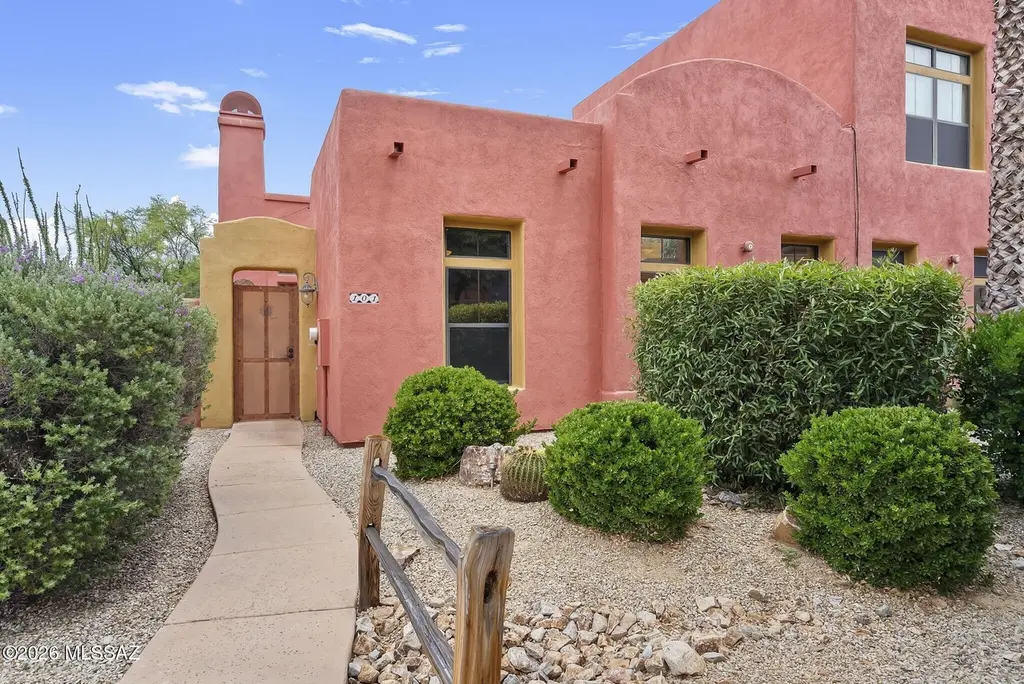
101 Post Way · Tubac, AZ
Flood risk 1/10 · Minimal
- FEMA flood zone
- X (unshaded)
- Chance of flooding over 30 yrs
- 0.0%
- Est. flood insurance / yr
- $507 – $1,088
Fire risk 7/10 · Major
- Est. fire insurance / yr
- $610 – $1,132
Heat risk 7/10 · Major
- Hot days now (above 101°F)
- 7 days/yr
- Hot days in 30 yrs
- 19 days/yr
Wind risk 1/10 · Minimal
- Chance of severe wind over 30 yrs
- —
Air-quality risk 1/10 · Minimal
- Unhealthy air days now
- 0 days/yr
- Unhealthy air days in 30 yrs
- 0 days/yr
Risk factors via First Street. Map © Google.
Why this score? — see what drove the D grade
The composite is a weighted blend of 9 inputs, each scored 0–100. Each bar is that input's sub-score; the figure is the points it added to the 100-point composite (weight × sub-score).
- Cash flow +12.1/30.0
- ARV discount +8.1/15.0
- Appreciation +4.9/10.0
- 1% rule +4.3/10.0
- DSCR +3.6/10.0
- Livability +3.4/5.0
- Rent growth +2.5/5.0
- Condition / age +2.5/5.0
- Schools +1.7/10.0
$245,000
🖨 Deal sheet (PDF) 📄 Offer letter ✓ Due diligence
Listing remarks MLS
Cheerful, open and bright 1 bedroom, 2 full baths, with a den (complete with built in Murphy bed and closet). This single level end unit home is one of a kind! Beautiful interior finishes, upgraded appliances and great furniture throughout. A warm and cozy kiva gas fireplace and gas BBQ complete the wonderful decorated courtyard. Approved for satellite TV. Guest parking adjoins the home.
Key facts
- Custom murphy bed
- Office system
- Pool
Tags
Property features AI
Finance
- HOA & community: Homeowners association with monthly fee; HOA amenities include pool, spa/hot tub, park, recreation room, and fitness center; HOA responsible for street maintenance and exterior maintenance of unit
Exterior
- Parking: Covered parking (1 space); Carport (1 space)
- Utilities: Water provided by a water company; Sewer connected
- Home design: Townhouse; One level; Level (accessible); Faces west
- Construction: Frame with stucco exterior; Built-up roof; Living area approximately 1,047
- Exterior features: Patio; Fencing: block with stucco finish; Borders common area; Paved road
Interior
- Kitchen: Dishwasher; Garbage disposal; Gas range; Microwave
- Bedrooms: Bedrooms: (details not specified)
- Flooring: Carpet; Ceramic tile
- Bathrooms: 2 full bathrooms
- Heating & cooling: Heat pump heating; Central air conditioning (heat pump)
- Interior features: Beamed ceilings; Walk-in closet(s); Two fireplaces (gas) — located in the great room and on the patio; Pre-wired for satellite dish
- Laundry & utility: Washer and dryer included
Neighborhood map
What this means for you Summary
Snapshot
- This is a 1-bed/2.0-bath townhouse listed at $245k.
Deal economics
- At list price, monthly cash flow is $-52 ($-624/yr) — negative.
- To cash-flow at today's rent, offer at most $236k (3.8% below list).
- To meet the 1% rule (rent ≥ 1% of price), the offer needs to be $228k (7.1% below list).
- Recommended offer: $228k (7.1% below list) — sets the bar for 1% rule.
- Cap rate 6.0% vs local median 3.5% in Tubac — top-decile yield for the area; either an underpriced asset or a hidden risk that comps aren't pricing in. Stress-test before assuming the spread holds.
Location & tenants
- Location reads 67/100 on livability (#60 in AZ) — a middle-class / working-renter tenant base. Strengths: crime A+, employment A, housing A; Watch: health & safety C-, amenities F, commute F.
- Santa Cruz Valley Unified District (4458) (town): math 12% / reading 26% proficiency, ranked #184 of 249 in AZ (top 74%) — low school quality limits family demand, transient renter base, plan for 1-2y turnover; 62% free/reduced lunch — lower-income household profile, screen leases tightly.
- Zoned schools: San Cayetano Elementary School (math 2% / reading 32%, grade F, #810 of 1,109 statewide, top 73%, 393 students, 69% FRL); Coatimundi Middle School (math 16% / reading 32%, grade F, #109 of 218 statewide, top 51%, 473 students, 69% FRL); Rio Rico High School (math 13% / reading 21%, grade F, #252 of 381 statewide, top 67%, 1,414 students, 72% FRL).
- Market conditions: 157 active listings in the ZIP; 340 units permitted in Santa Cruz County in 2024 (0 in 5+ unit buildings).
Forward outlook
- In year one you build about $1k of equity ($2k loan paydown + $-348 appreciation (-0.1% local appreciation)).
- Santa Cruz County population projected at -22% by 2050 — secular population decline; favor cash flow + early exit over multi-decade hold.
Negotiation context
- It's been on market 19 days — a 2% lower offer ($241k) is reasonable based on typical stale-listing flexibility.
- 10 sale attempts since 18y ago with the ask held roughly flat each time — persistent listings suggest the price (not the market) is what's stuck; bring a comps-based counter.
Risks & watch-outs
- Climate carrying-cost: major wildfire risk; extreme-heat days projected 7→19/yr by 2055 (HVAC capex compounding) — expect insurance premiums to compound above CPI over the hold.
Questions for the listing agent
- What do current leases actually rent for vs. the listed asking? Can we see a recent rent roll and the last 12 months of T-12 income?
- What does the HOA fee cover, when was the last increase, and are there any pending special assessments or reserve-fund shortfalls?
- Is there a deadline driving the sale (1031 exchange, divorce, estate, relocation)? That informs how much negotiation room exists.
- The area grade is low — what's the realistic commute time and amenity access for the typical tenant pool here? Any planned neighborhood developments (good or bad) we should know about?
- What's the average days-on-market for RENTAL listings here right now (not sales)? A rising rental-DOM trend means longer vacancies and softer asking-rent achievability than the comps imply.
- What's the recent tenant-quality profile in this submarket — average credit score on applications, eviction rate, late-payment / NSF rate, and stable-employment percentage? A property-management company in the area should have these aggregated.
- How much new for-sale + rental construction is in the pipeline within 1–3 miles? Heavy new supply typically softens prices + rents 12–24 months out; constrained supply supports both.
Investment metrics
- 1% rule
- 0.93% ✗
- Cap rate
- 6.04%
- Cash-on-cash
- -0.91%
- DSCR
- 0.96
- GRM
- 9.0
CMA / ARV
- ARV (on-the-fly)
- $248,139
- Comps found
- 12
Show comp detail 12 sales within ~0.75 mi
| Address | Dist | Beds/Ba | Sqft | Sold | Price | $/sf | Match |
|---|---|---|---|---|---|---|---|
| 604 Post Way | 0.07mi | 1/2.0 | 1,052 (+0%) | 3mo | $215,000 | $204 | 94 |
| 109 Post Way | 0.02mi | 1/2.0 | 1,008 (-4%) | 1mo | $197,000 | $195 | 92 |
| 110 Post Way | 0.02mi | 1/2.0 | 1,008 (-4%) | 2mo | $239,000 | $237 | 91 |
| 303 Post Way | 0.02mi | 1/2.0 | 1,047 (0%) | 12mo | $241,000 | $230 | 88 |
| 1004 Lombard Way | 0.15mi | 2/2.0 (+1) | 1,046 (-0%) | 1mo | $255,000 | $244 | 87 |
| 410 Post Way | 0.07mi | 1/2.0 | 1,008 (-4%) | 11mo | $260,000 | $258 | 81 |
| 1109 Lombard Way | 0.13mi | 2/2.0 (+1) | 1,106 (+6%) | 2mo | $225,000 | $203 | 78 |
| 1504 Golden Gate Way | 0.21mi | 2/2.0 (+1) | 1,110 (+6%) | 3mo | $215,000 | $194 | 73 |
| 308 Post Way | 0.02mi | 1/1.5 | 899 (-14%) | 1mo | $215,000 | $239 | 72 |
| 209 Post Way | 0.07mi | 1/1.5 | 899 (-14%) | 0mo | $245,000 | $273 | 71 |
| 1306 Golden Gate Way | 0.21mi | 2/2.0 (+1) | 1,093 (+4%) | 14mo | $290,000 | $265 | 66 |
| 1503 Golden Gate Way | 0.21mi | 2/2.0 (+1) | 1,110 (+6%) | 12mo | $262,500 | $236 | 65 |
Match score weights: distance 35% · size 25% · config 20% · recency 20%. Top-matched comps best support the ARV.
Projected returns pro-forma
-0.14% appreciation · 3.0% rent growth · sell at horizon
- IRR
- -3.7%
- Equity multiple
- 0.83×
- Total profit
- $-11,980
- Equity at exit
- $69,407
- IRR
- 2.2%
- Equity multiple
- 1.24×
- Total profit
- $16,143
- Equity at exit
- $82,060
Cash invested: $68,600 (down + closing). Projections, not guarantees.
Landlord ↔ Tenant lean methodology
- Overall (STATE)
- 87 Strongly Landlord-Friendly
- State Arizona
- 87 Strongly Landlord-Friendly · R+3
- County
- — inherits STATE
- City
- — inherits STATE
ZIP-level market 85646
- Home prices YoY
- -0.1%
- Active inventory
- 157
- Price-to-rent
- 9.0×
Monthly cashflow live
- Estimated rent
- $2,275 medium interval (Pro) →
- Mortgage (P&I)
- −$1,285
- Tax from tax record
- −$164 /mo · $1,962/yr
- Insurance
- −$102
- HOA
- −$299
- Vacancy / Maint / Mgmt
- −$478
- Net cashflow
- $-52
Break-even live
Sensitivity live
| Price | -10% $87 | -5% $17 | +0% $-52 | +5% $-121 | +10% $-191 |
|---|---|---|---|---|---|
| Rent | -10% $-232 | -5% $-142 | +0% $-52 | +5% $38 | +10% $128 |
| Rate | -1.0pp $71 | -0.5pp $10 | base $-52 | +0.5pp $-116 | +1.0pp $-180 |
UW: 25.0% down · 7.5% · 30yr · 1.5% tax · 5.0% vac · 8.0% maint · 8.0% mgmt
Financing live
Cash to close
- Down payment
- $61,250
- Closing costs
- $7,350
- Reserves months
- —
- Total cash needed
- —
Loan-product check · same deal, 3 products live
Conventional
25% down · 7.5% · 30yr
- Down + closing
- —
- Monthly P&I
- —
- Monthly cashflow
- —
- DSCR
- —
- Eligible?
- —
Personal DTI + credit; lowest rate.
DSCR
20% down · 8.5% · 30yr
- Down + closing
- —
- Monthly P&I
- —
- Monthly cashflow
- —
- DSCR
- —
- Eligible?
- —
No personal income docs; deal must DSCR.
Hard money
10% down · 12.0% · 12mo
- Down + closing
- —
- Monthly P&I
- —
- Monthly cashflow
- —
- DSCR
- —
- Eligible?
- —
Short-term bridge; refi at stabilization.
HOA detail
- Monthly dues
- $299 · $3,588/yr
- Likely covers
- gas
Listing history 13 events
-
2026-06-21days on market $245,000 Active 19 DOM
-
2026-06-18days on market $245,000 Active 16 DOM
-
2026-06-17days on market $245,000 Active 15 DOM
-
2026-06-16days on market $245,000 Active 14 DOM
-
2026-06-15days on market $245,000 Active 13 DOM
-
2026-06-13days on market $245,000 Active 11 DOM
-
2026-06-10days on market $245,000 Active 8 DOM
-
2026-06-09days on market $245,000 Active 7 DOM
-
2026-06-08days on market $245,000 Active 6 DOM
-
2026-06-07days on market $245,000 Active 5 DOM
-
2026-06-05days on market $245,000 Active 2 DOM
-
2026-06-03remarks 699-char remark
-
2026-06-03$245,000 Active 1 DOM
ⓘ Source: listings_history table (triggers on properties + properties_extension) + one-shot
backfill from property_details.listing_events for pre-trigger history.
Tax reassessment forecast AZ · Resets to sale price
- Current annual tax
- $1,962 · $164/mo
- Projected year-2 tax
- $1,962 · $164/mo
- Expected delta
- $0/yr ($0/mo · -0.0%)
ⓘ Screening estimate from a state-policy table — verify with the county assessor before closing.
Climate risk First Street
- Flood 1/10 Low FEMA zone X (unshaded) · 0% chance over 30 yrs
- Wildfire 7/10 Severe
- Heat 7/10 Severe 7 d/yr ≥101°F today · 19 d/yr by 30 yrs out
- Wind 1/10 Low
- Air quality 1/10 Low 0 unhealthy d/yr today · 0 by 30 yrs out
Nearby sold comps map
Loading sold comps map…
Walkable amenities ~0.75 mi
Loading nearby amenities…
Taxation est. · year 1
- Rental income
- $27,302
- − Mortgage interest
- −$13,724
- − Property taxes
- −$1,962
- − Insurance
- −$1,225
- − Repairs & maintenance
- −$2,184
- − Management
- −$2,184
- − HOA
- −$3,588
- − Depreciation
- −$7,127
- Taxable loss
- −$4,693
- Est. tax savings @ 24.0%
- +$1,126
- After-tax cash flow
- $502/yr
For passive investors: Depreciation is non-cash, so a rental often shows a tax loss while cash-flowing — sheltering income. Rental losses are passive: they offset passive income freely, and up to $25,000/yr can offset ordinary (W-2) income if you actively participate and your MAGI is under $100k (phasing out to $0 by $150k); unused losses carry forward. On sale, claimed depreciation is recaptured at up to 25%, and gains may owe capital-gains tax (a 1031 exchange can defer both). Figures are a year-1 estimate at your 24.0% rate — not tax advice; consult a CPA.
Schools (NCES district)
- District
- Santa Cruz Valley Unified District (4458)
- NCES district ID
- 0407520
- Math proficiency
- 12% ▼ -19.00%
- Reading proficiency
- 26% ▼ -9.00%
- Median HH income
- $48,019
- Composite
- 16.84/100
- National rank
- #9147
- State rank
- #184 of 249 in AZ
Livability — Tubac
- Score
- 67/100
- State rank
- #60
- US rank
- #10219
Category grades
Schools grade is shown separately in the Schools card above.
Census & demographics
- Census place
- Tubac, AZ
- City population
- 1,280
- Population (ZIP)
- 1,280
Population outlook (Santa Cruz County) Hauer SSP2
- Today (2025)
- 43,796 people
- By 2030
- 42,097 · -3.9%
- By 2040
- 38,235 · -12.7%
- By 2050
- 34,224 · -21.9%
- By 2075
- 26,014 · -40.6%
- By 2100
- 18,165 · -58.5%
Race, ethnicity, and origin ACS 2023
- Neighborhood character
- Predominantly White (75%)
- Race & ethnicity
- White 75% Hispanic / Latino 20% Two or more races 14% Native American 2%
- Hispanic origin (detail)
- Mexican 20%
- Common ancestry
- Slovak 5% Italian 2% Subsaharan African 2%
- Foreign-born
- 8% · Canada
- Languages at home
- 80% English-only · Spanish 20%
Political lean MEDSL · Santa Cruz
- 2024 margin
- D (+18.6) · D 58.9% · R 40.3%
- 2008→2024 swing
- -12.7pp toward R · 2008: 31.3pp · 2024: 18.6pp
- All cycles
- 2024: D+18.6 2020: D+35.5 2016: D+47.1 2012: D+37.8 2008: D+31.3
Not yet ingested
- Civics
- —
Market trends
- HPI YoY
- ▼ -0.14%
- Current HPI
- 298.5755
- Rent YoY
- —
- Metro
- —
- State GDP YoY
- ▲ 4.54%
- F500 in state
- 20
Industry mix (Fortune 500 HQ in AZ)
| Industry | F500 HQs | Revenue |
|---|---|---|
| Technology | 2 | $13B |
|
||
| Mining / Metals | 1 | $23B |
|
||
| Environmental Services | 1 | $16B |
|
||
| Metals / Steel | 1 | $14B |
|
||
| Technology Distribution | 1 | $9B |
|
||
| Homebuilding | 1 | $8B |
|
||
Price history
-2.7% since first listed22 events — show timeline
- 2026-06-02 Listed $245,000 MLSSAZ
- 2024-04-18 Sold (Public Records) $290,000 Public Records
- 2024-04-18 Listed $290,000 MLSSAZ
- 2024-04-18 Sold (MLS) $290,000 MLSSAZ
- 2018-12-04 Sold (Public Records) $135,000 Public Records
- 2018-12-04 Sold (MLS) $135,000 MLSSAZ
- 2018-10-17 Listed $150,000 MLSSAZ
- 2017-02-28 Sold (Public Records) $130,000 Public Records
- 2017-02-28 Sold (MLS) $130,000 MLSSAZ
- 2016-12-09 Listed $134,500 MLSSAZ
- 2015-08-02 Listing Removed — MLSSAZ
- 2015-03-16 Listing Removed — MLSSAZ
- 2015-02-02 Listed $164,900 MLSSAZ
- 2015-02-02 Listed $164,900 MLSSAZ
- 2009-10-29 Listing Removed — MLSSAZ
- 2009-10-17 Listed $80,000 MLSSAZ
- 2009-04-29 Listed $80,000 MLSSAZ
- 2009-04-29 Listed $224,900 MLSSAZ
- 2009-01-31 Listing Removed — MLSSAZ
- 2008-02-18 Listed $249,000 MLSSAZ
- 2006-05-01 Sold (Public Records) $251,890 Public Records
- 2006-05-01 Sold (Public Records) $251,890 Public Records
Property tax history
+3.2%/yrLatest (2025): $1,962 · +6.0% YoY. Source: county tax records.
Cash-flow waterfall
monthlySold comps — $/sqft
last 12 mo · ≤1 miLoading sold comps…