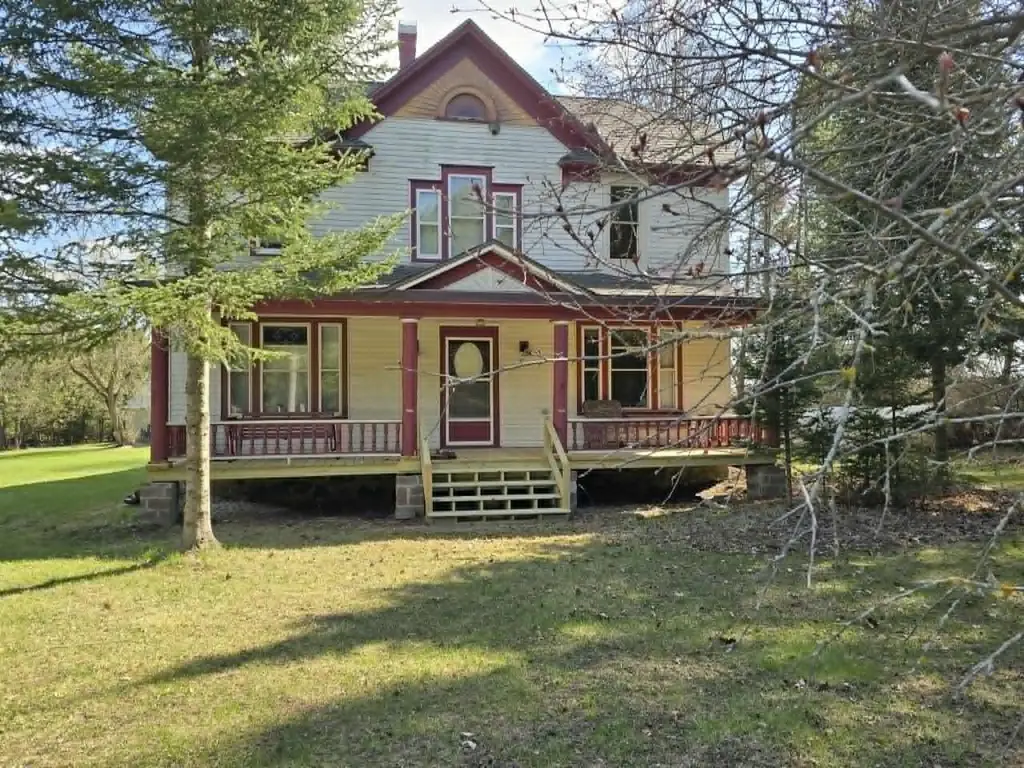
W8145 County Rd P
Pound, WI 54161
$189,000D-
3 bd · 1.0 ba ·
1,750 sqft ·
Built 1900
· Other
· Pending
· 29 DOM
Cashflow @ list (25.0% down · 7.5%)
Estimated rent
$1,137/mo
Mortgage (P&I)
−$991
Tax + insurance
−$221
HOA
−$0
Vac / Maint / Mgmt
−$239
Net cashflow
$-314/mo
Annual
$-3,768/yr
Cap rate
4.30%
Cash-on-cash
-7.12%
DSCR
0.68
1% rule
0.60%
Cash to close
$52,920
Investor read
- This is a 3-bed/1.0-bath other listed at $189k.
- At list price, monthly cash flow is $-314 ($-4k/yr) — negative.
- To cash-flow at today's rent, offer at most $134k (29.3% below list).
- To meet the 1% rule (rent ≥ 1% of price), the offer needs to be $114k (39.8% below list).
- It's been on market 29 days — a 2% lower offer ($186k) is reasonable based on typical stale-listing flexibility.
- Recommended offer: $114k (39.8% below list) — sets the bar for 1% rule.
- In year one you build about $18k of equity ($1k loan paydown + $16k appreciation (8.6% local appreciation)).
- Location reads 62/100 on livability (#631 in WI) — a middle-class / working-renter tenant base. Strengths: cost of living A+, housing A+; Watch: crime C-, amenities F, commute F.
- Coleman School District (rural): math 37% / reading 40% proficiency, ranked #187 of 342 in WI (top 55%) — families likely to look elsewhere, expect single-tenant / working-renter base with shorter leases.
- Zoned schools: Coleman Elementary (math 52% / reading 42%, grade D-, #319 of 1,041 statewide, top 34%, 363 students, 46% FRL); Coleman Middle (math 27% / reading 42%, grade F, #208 of 383 statewide, top 58%, 142 students, 41% FRL); Coleman High (math 34% / reading 24%, grade F, #228 of 483 statewide, top 52%, 233 students, 38% FRL).
- Watch-outs: built in 1900 — expect roof / HVAC / electrical / plumbing capex.
- Market conditions: 22 active listings in the ZIP; 145 units permitted in Marinette County in 2024 (0 in 5+ unit buildings).
- Marinette County population projected at -26% by 2050 — secular population decline; favor cash flow + early exit over multi-decade hold.
- Current owner paid $145k; 30% above their basis — modest negotiation headroom, anchor on the comps not their cost.
- By year 3, paydown + projected appreciation supports a ~$44k cash-out refi (75% LTV) — recoverable capital for the next deal without selling this one.
Questions for listing agent
- What do current leases actually rent for vs. the listed asking? Can we see a recent rent roll and the last 12 months of T-12 income?
- Built in 1900 — when were the roof, HVAC, electrical panel, plumbing, and water heater last replaced?
- Is there a deadline driving the sale (1031 exchange, divorce, estate, relocation)? That informs how much negotiation room exists.
- Schools are F-rated, which usually means shorter tenancies and higher turnover. Who's the typical renter profile here, and what's been the actual vacancy rate?
- The area grade is low — what's the realistic commute time and amenity access for the typical tenant pool here? Any planned neighborhood developments (good or bad) we should know about?
- What's the average days-on-market for RENTAL listings here right now (not sales)? A rising rental-DOM trend means longer vacancies and softer asking-rent achievability than the comps imply.
- What's the recent tenant-quality profile in this submarket — average credit score on applications, eviction rate, late-payment / NSF rate, and stable-employment percentage? A property-management company in the area should have these aggregated.
- How much new for-sale + rental construction is in the pipeline within 1–3 miles? Heavy new supply typically softens prices + rents 12–24 months out; constrained supply supports both.
CashFlowRE · CFR-ET3XAX5H19P9PV
· Data 13 min ago
cashflowre.app · 2026-05-29