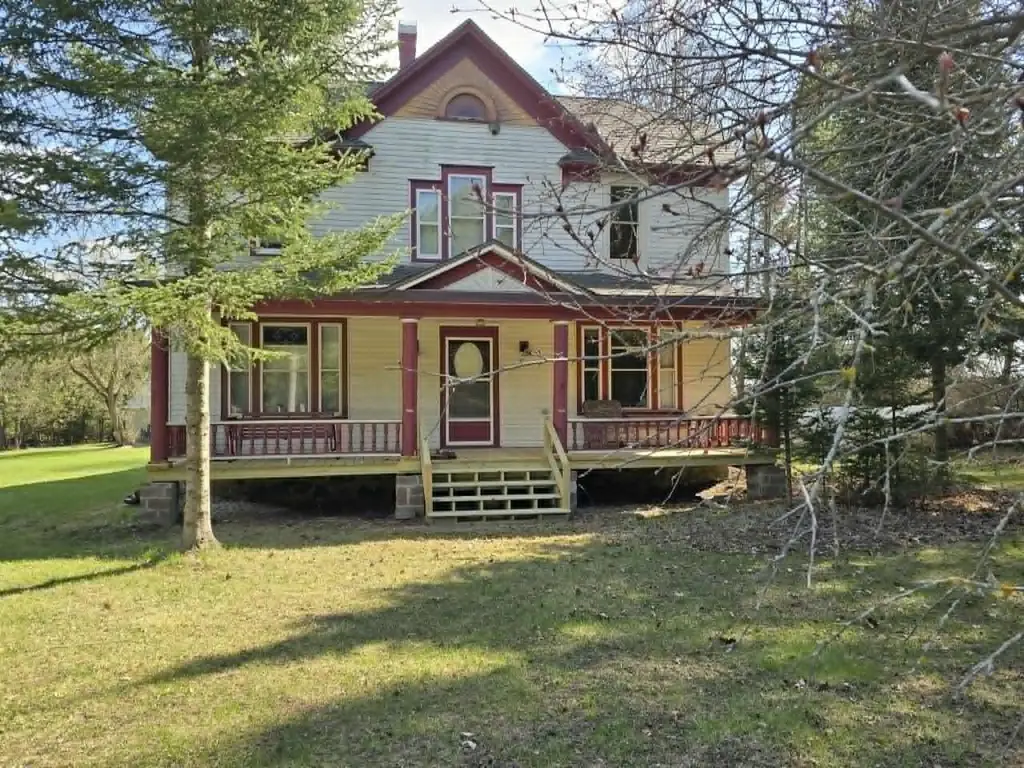
W8145 County Rd P · Beaver, WI
Flood risk 1/10 · Minimal
- FEMA flood zone
- X
- Chance of flooding over 30 yrs
- 0.0%
- Est. flood insurance / yr
- $473 – $860
Fire risk 1/10 · Minimal
- Est. fire insurance / yr
- $636 – $1,182
Heat risk 1/10 · Minimal
- Hot days now (above 93°F)
- 7 days/yr
- Hot days in 30 yrs
- 13 days/yr
Wind risk 1/10 · Minimal
- Chance of severe wind over 30 yrs
- —
Air-quality risk 1/10 · Minimal
- Unhealthy air days now
- 0 days/yr
- Unhealthy air days in 30 yrs
- 0 days/yr
Risk factors via First Street. Map © Google.
Why this score? — see what drove the D- grade
The composite is a weighted blend of 9 inputs, each scored 0–100. Each bar is that input's sub-score; the figure is the points it added to the 100-point composite (weight × sub-score).
- Appreciation +9.3/10.0
- ARV discount +7.5/15.0
- Cash flow +6.6/30.0
- Schools +3.3/10.0
- Rent growth +2.5/5.0
- Livability +2.5/5.0
- Condition / age +2.5/5.0
- 1% rule +1.0/10.0
- DSCR +0.8/10.0
$189,000
🖨 Deal sheet (PDF) 📄 Offer letter ✓ Due diligence
Listing remarks
Wonderful farmhouse with wrap around porch in back of home. House has a second bath in the kitchen that can be finished by new buyer. The house features high ceilings, new roof in 2020 and a lot of original hardwood, woodwork throughout as well as a built in cabinet in the dining area. Wooded lot gives you the peaceful and private life. The cabin on the property has electricity and a woodburning fireplace. The barn and garage gives you endless storage for vehicles, tools, or anything you need to store.
Key facts
- Wrap around porch
- Original hardwood
- Built in cabinet
Tags
Property features AI
Exterior
- Parking: Detached 2-car garage (2 garage parking spaces)
- Utilities: Private well; Private septic system; Electric service; LP gas
- Home design: 2-story single-family home; Construction completed
- Construction: Vinyl exterior
- Exterior features: Wooded lot; Lot is approximately 4 acres
Interior
- Kitchen: Kitchen on main level about 11 x 11; Includes refrigerator and stove
- Bedrooms: Master bedroom (upper level) about 15 x 14; Second bedroom (upper level) about 15 x 11; Third bedroom (main level) about 15 x 11
- Bathrooms: One full bathroom
- Heating & cooling: Electric and LP gas heating; Other heating/cooling (see remarks)
- Interior features: Partial stone basement
- Laundry & utility: Washer and dryer included
Neighborhood map
What this means for you Summary
Snapshot
- This is a 3-bed/1.0-bath other listed at $189k.
Deal economics
- At list price, monthly cash flow is $-314 ($-4k/yr) — negative.
- To cash-flow at today's rent, offer at most $134k (29.3% below list).
- To meet the 1% rule (rent ≥ 1% of price), the offer needs to be $114k (39.8% below list).
- Recommended offer: $114k (39.8% below list) — sets the bar for 1% rule.
Location & tenants
- Location reads: area grade D — affects rentability + tenant quality, not the cash-flow math above.
- Coleman School District (rural): math 37% / reading 40% proficiency, ranked #187 of 342 in WI (top 55%) — families likely to look elsewhere, expect single-tenant / working-renter base with shorter leases.
- Zoned schools: Coleman Elementary (math 52% / reading 42%, grade D-, #319 of 1,041 statewide, top 34%, 363 students, 46% FRL); Coleman Middle (math 27% / reading 42%, grade F, #208 of 383 statewide, top 58%, 142 students, 41% FRL); Coleman High (math 34% / reading 24%, grade F, #228 of 483 statewide, top 52%, 233 students, 38% FRL).
- Market conditions: 22 active listings in the ZIP; 145 units permitted in Marinette County in 2024 (0 in 5+ unit buildings).
Forward outlook
- In year one you build about $18k of equity ($1k loan paydown + $16k appreciation (8.6% local appreciation)).
- Marinette County population projected at -26% by 2050 — secular population decline; favor cash flow + early exit over multi-decade hold.
- By year 3, paydown + projected appreciation supports a ~$44k cash-out refi (75% LTV) — recoverable capital for the next deal without selling this one.
Negotiation context
- It's been on market 29 days — a 2% lower offer ($186k) is reasonable based on typical stale-listing flexibility.
- Current owner paid $145k; 30% above their basis — modest negotiation headroom, anchor on the comps not their cost.
Risks & watch-outs
- Watch-outs: built in 1900 — expect roof / HVAC / electrical / plumbing capex.
Questions for the listing agent
- What do current leases actually rent for vs. the listed asking? Can we see a recent rent roll and the last 12 months of T-12 income?
- Built in 1900 — when were the roof, HVAC, electrical panel, plumbing, and water heater last replaced?
- Is there a deadline driving the sale (1031 exchange, divorce, estate, relocation)? That informs how much negotiation room exists.
- The area grade is low — what's the realistic commute time and amenity access for the typical tenant pool here? Any planned neighborhood developments (good or bad) we should know about?
- What's the average days-on-market for RENTAL listings here right now (not sales)? A rising rental-DOM trend means longer vacancies and softer asking-rent achievability than the comps imply.
- What's the recent tenant-quality profile in this submarket — average credit score on applications, eviction rate, late-payment / NSF rate, and stable-employment percentage? A property-management company in the area should have these aggregated.
- How much new for-sale + rental construction is in the pipeline within 1–3 miles? Heavy new supply typically softens prices + rents 12–24 months out; constrained supply supports both.
Investment metrics
- 1% rule
- 0.60% ✗
- Cap rate
- 4.30%
- Cash-on-cash
- -7.12%
- DSCR
- 0.68
- GRM
- 13.8
CMA / ARV
- ARV (median comp)
- $383,445
- List price
- $189,000
- Delta
- -50.71%
- Verdict
- UNDERPRICED
- Comps
- 2 within 2.0 mi
Projected returns pro-forma
8.57% appreciation · 3.0% rent growth · sell at horizon
- IRR
- 16.0%
- Equity multiple
- 2.22×
- Total profit
- $64,791
- Equity at exit
- $151,006
- IRR
- 15.4%
- Equity multiple
- 4.84×
- Total profit
- $203,290
- Equity at exit
- $307,110
Cash invested: $52,920 (down + closing). Projections, not guarantees.
Landlord ↔ Tenant lean methodology
- Overall (STATE)
- 73 Landlord-Friendly
- State Wisconsin
- 73 Landlord-Friendly · R+2
- County
- — inherits STATE
- City
- — inherits STATE
ZIP-level market 54161
- Home prices YoY
- 3.6%
- Active inventory
- 22
- Price-to-rent
- 13.8×
Monthly cashflow live
- Estimated rent
- $1,137 medium interval (Pro) →
- Mortgage (P&I)
- −$991
- Tax from tax record
- −$143 /mo · $1,712/yr
- Insurance
- −$79
- HOA
- −$0
- Vacancy / Maint / Mgmt
- −$239
- Net cashflow
- $-314
Break-even live
Sensitivity live
| Price | -10% $-207 | -5% $-260 | +0% $-314 | +5% $-367 | +10% $-421 |
|---|---|---|---|---|---|
| Rent | -10% $-404 | -5% $-359 | +0% $-314 | +5% $-269 | +10% $-224 |
| Rate | -1.0pp $-219 | -0.5pp $-266 | base $-314 | +0.5pp $-363 | +1.0pp $-413 |
UW: 25.0% down · 7.5% · 30yr · 1.5% tax · 5.0% vac · 8.0% maint · 8.0% mgmt
Financing live
Cash to close
- Down payment
- $47,250
- Closing costs
- $5,670
- Reserves months
- —
- Total cash needed
- —
Loan-product check · same deal, 3 products live
Conventional
25% down · 7.5% · 30yr
- Down + closing
- —
- Monthly P&I
- —
- Monthly cashflow
- —
- DSCR
- —
- Eligible?
- —
Personal DTI + credit; lowest rate.
DSCR
20% down · 8.5% · 30yr
- Down + closing
- —
- Monthly P&I
- —
- Monthly cashflow
- —
- DSCR
- —
- Eligible?
- —
No personal income docs; deal must DSCR.
Hard money
10% down · 12.0% · 12mo
- Down + closing
- —
- Monthly P&I
- —
- Monthly cashflow
- —
- DSCR
- —
- Eligible?
- —
Short-term bridge; refi at stabilization.
Listing history 11 events
-
2026-06-12statusdays on market $189,000 Pending 29 DOM
-
2026-06-09days on market $189,000 Active w/ Contract 28 DOM
-
2026-06-08days on market $189,000 Active w/ Contract 27 DOM
-
2026-06-08days on market $189,000 Active w/ Contract 26 DOM
-
2026-06-05days on market $189,000 Active w/ Contract 24 DOM
-
2026-06-03days on market $189,000 Active w/ Contract 22 DOM
-
2026-06-02days on market $189,000 Active w/ Contract 21 DOM
-
2026-06-01days on market $189,000 Active w/ Contract 20 DOM
-
2026-05-31days on market $189,000 Active w/ Contract 19 DOM
-
2026-05-12$189,000 Active 507-char remark
-
2021-09-07soldstatus $145,000
ⓘ Source: listings_history table (triggers on properties + properties_extension) + one-shot
backfill from property_details.listing_events for pre-trigger history.
Tax reassessment forecast WI · Partial reset (capped growth)
- Current annual tax
- $1,712 · $143/mo
- Projected year-2 tax
- $2,604 · $217/mo
- Expected delta
- +$892/yr (+$74/mo · 52.1%)
ⓘ Screening estimate from a state-policy table — verify with the county assessor before closing.
Climate risk First Street
- Flood 1/10 Low FEMA zone X · 0% chance over 30 yrs
- Wildfire 1/10 Low
- Heat 1/10 Low 7 d/yr ≥93°F today · 13 d/yr by 30 yrs out
- Wind 1/10 Low
- Air quality 1/10 Low 0 unhealthy d/yr today · 0 by 30 yrs out
Nearby sold comps map
Loading sold comps map…
Walkable amenities ~0.75 mi
Loading nearby amenities…
Taxation est. · year 1
- Rental income
- $13,649
- − Mortgage interest
- −$10,587
- − Property taxes
- −$1,712
- − Insurance
- −$945
- − Repairs & maintenance
- −$1,092
- − Management
- −$1,092
- − Depreciation
- −$5,498
- Taxable loss
- −$7,277
- Est. tax savings @ 24.0%
- +$1,746
- After-tax cash flow
- $-2,021/yr
For passive investors: Depreciation is non-cash, so a rental often shows a tax loss while cash-flowing — sheltering income. Rental losses are passive: they offset passive income freely, and up to $25,000/yr can offset ordinary (W-2) income if you actively participate and your MAGI is under $100k (phasing out to $0 by $150k); unused losses carry forward. On sale, claimed depreciation is recaptured at up to 25%, and gains may owe capital-gains tax (a 1031 exchange can defer both). Figures are a year-1 estimate at your 24.0% rate — not tax advice; consult a CPA.
Schools (NCES district)
- District
- Coleman School District
- NCES district ID
- 5502760
- Math proficiency
- 37% ▼ -7.00%
- Reading proficiency
- 40% ▼ -7.00%
- Median HH income
- $46,086
- Composite
- 32.87/100
- National rank
- #5611
- State rank
- #187 of 342 in WI
Livability — Beaver
No livability data for this city. (Only ~50 U.S. cities are tracked.)
Census & demographics
- Population (ZIP)
- 2,683
Population outlook (Marinette County) Hauer SSP2
- Today (2025)
- 38,716 people
- By 2030
- 37,015 · -4.4%
- By 2040
- 32,824 · -15.2%
- By 2050
- 28,502 · -26.4%
- By 2075
- 20,562 · -46.9%
- By 2100
- 15,072 · -61.1%
Race, ethnicity, and origin ACS 2023
- Neighborhood character
- Predominantly White (92%)
- Race & ethnicity
- White 92% Hispanic / Latino 5% Two or more races 3%
- Hispanic origin (detail)
- Mexican 5%
- Common ancestry
- Romanian 21% Lithuanian 4% Portuguese 3%
- Foreign-born
- 3% · Canada
- Languages at home
- 95% English-only · Spanish 4% German/W. Germanic 1%
Political lean MEDSL · Marinette
- 2024 margin
- Solid R (+38.0) · D 30.4% · R 68.4% · Other 1.1%
- 2008→2024 swing
- -44.9pp toward R · 2008: 6.9pp · 2024: -38.0pp
- All cycles
- 2024: R+38.0 2020: R+34.5 2016: R+33.8 2012: R+3.6 2008: D+6.9
Not yet ingested
- Civics
- —
Market trends
- HPI YoY
- ▲ 8.57%
- Current HPI
- 244.4201
- Rent YoY
- —
- Metro
- —
- State GDP YoY
- ▲ 2.10%
- F500 in state
- 20
Industry mix (Fortune 500 HQ in WI)
| Industry | F500 HQs | Revenue |
|---|---|---|
| Industrial Machinery | 4 | $23B |
|
||
| Industrial Technology | 2 | $36B |
|
||
| Insurance | 1 | $36B |
|
||
| Professional Services | 1 | $19B |
|
||
| Utilities | 1 | $9B |
|
||
| Consumer Goods | 1 | $3B |
|
||
Price history
+30.3% since first listed4 events — show timeline
- 2026-06-11 Pending — RANW
- 2026-05-19 Contingent — RANW
- 2026-05-12 Listed $189,000 RANW
- 2021-09-07 Sold (Public Records) $145,000 Public Records
Property tax history
+2.4%/yrLatest (2025): $1,712 · -19.9% YoY. Source: county tax records.
Cash-flow waterfall
monthlySold comps — $/sqft
last 12 mo · ≤1 miLoading sold comps…