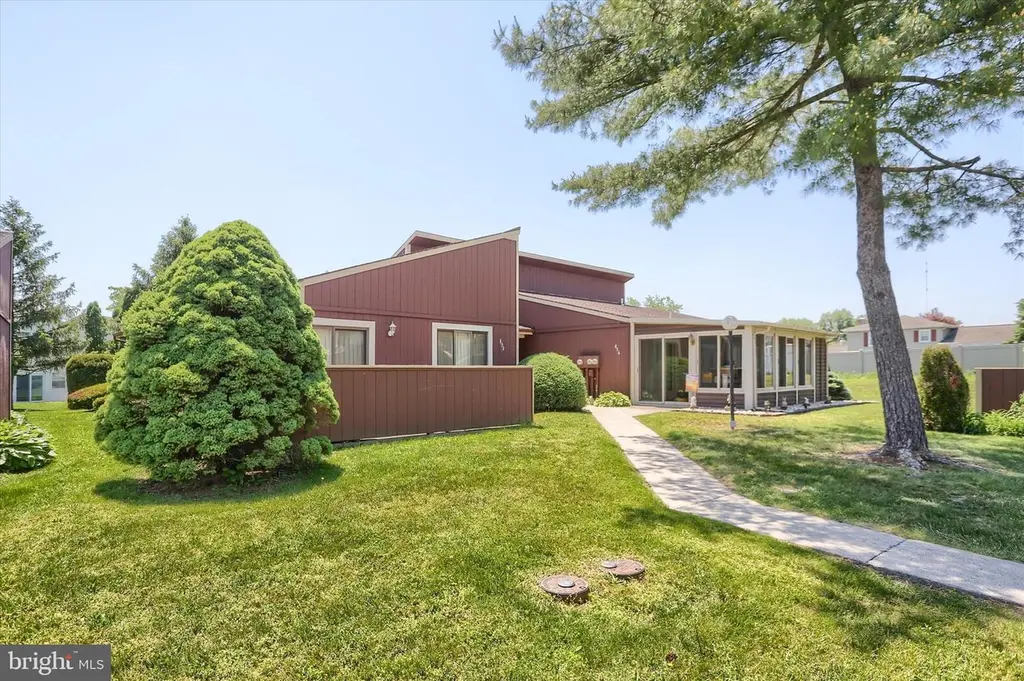
854 Melissa Ct
Enola, PA 17025
$129,900D+
2 bd · 2.0 ba ·
1,100 sqft ·
Built 1989
· Townhouse
· Pending
· 3 DOM
Cashflow @ list (25.0% down · 7.5%)
Estimated rent
$1,582/mo
Mortgage (P&I)
−$681
Tax + insurance
−$226
HOA
−$431
Vac / Maint / Mgmt
−$332
Net cashflow
$-88/mo
Annual
$-1,058/yr
Cap rate
5.48%
Cash-on-cash
-2.91%
DSCR
0.87
1% rule
1.22%
Cash to close
$36,372
Investor read
- This is a 2-bed/2.0-bath townhouse listed at $130k.
- At list price, monthly cash flow is $-88 ($-1k/yr) — negative.
- To cash-flow at today's rent, offer at most $114k (12.0% below list).
- Meets the 1% rule at list price ($2k rent vs $130k).
- Only 3 days on market — expect competitive offers; lowballing is unlikely to land.
- Recommended offer: $114k (12.0% below list) — sets the bar for cash-flow.
- Local home prices are declining (-3.0%/yr); year-one equity from $898 of loan paydown is wiped out by about $4k of value loss. Plan a longer hold.
- Location reads 79/100 on livability (#243 in PA, #2,077 nationally) — a middle-class / working-renter tenant base. Strengths: cost of living A+, housing A+, health & safety A+; Watch: employment C-, commute D+, amenities F.
- East Pennsboro Area SD (suburban): math 30% / reading 57% proficiency, ranked #275 of 539 in PA (top 51%) — families likely to look elsewhere, expect single-tenant / working-renter base with shorter leases.
- Zoned schools: East Pennsboro El Sch (math 35% / reading 53%, grade F, #858 of 1,518 statewide, top 57%, 588 students, 50% FRL); East Pennsboro Area Ms (math 14% / reading 56%, grade F, #322 of 512 statewide, top 64%, 563 students, 50% FRL); East Pennsboro Area Shs (math 82% / reading 72%, grade A-, #22 of 437 statewide, top 5%, 761 students, 36% FRL) — zoned schools average 45% FRL vs 24% district-wide (21 pts higher); higher-poverty schools than district average — tighter screening recommended.
- Watch-outs: HOA is 27% of rent.
- Market conditions: Rents rising fast (+6.5%/yr); 131 active listings in the ZIP; 6 comparable units currently listed for rent nearby; rentals at typical pace (median 16d on market — plan ~3-4 weeks tenant-placement turnaround); solid renter incomes; 1,052 units permitted in Cumberland County in 2024 (310 in 5+ unit buildings).
- Cumberland County population projected at +17% by 2050 — long-run rental-demand tailwind backs the buy-and-hold thesis.
- Current owner paid $110k; 18% above their basis — modest negotiation headroom, anchor on the comps not their cost.
- Cap rate 5.5% vs local median 3.4% in Enola — top-decile yield for the area; either an underpriced asset or a hidden risk that comps aren't pricing in. Stress-test before assuming the spread holds.
Questions for listing agent
- What do current leases actually rent for vs. the listed asking? Can we see a recent rent roll and the last 12 months of T-12 income?
- What does the HOA fee cover, when was the last increase, and are there any pending special assessments or reserve-fund shortfalls?
- Is there a deadline driving the sale (1031 exchange, divorce, estate, relocation)? That informs how much negotiation room exists.
- Schools are B-rated — typically a magnet for longer-tenancy family renters. What's the average tenant stay here, and is there a school-zone premium baked into asking?
- The area grade is low — what's the realistic commute time and amenity access for the typical tenant pool here? Any planned neighborhood developments (good or bad) we should know about?
- What's the average days-on-market for RENTAL listings here right now (not sales)? A rising rental-DOM trend means longer vacancies and softer asking-rent achievability than the comps imply.
- What's the recent tenant-quality profile in this submarket — average credit score on applications, eviction rate, late-payment / NSF rate, and stable-employment percentage? A property-management company in the area should have these aggregated.
- How much new for-sale + rental construction is in the pipeline within 1–3 miles? Heavy new supply typically softens prices + rents 12–24 months out; constrained supply supports both.
CashFlowRE · CFR-ETBXMBAPFG68VX
· Data 2 weeks ago
cashflowre.app · 2026-05-29