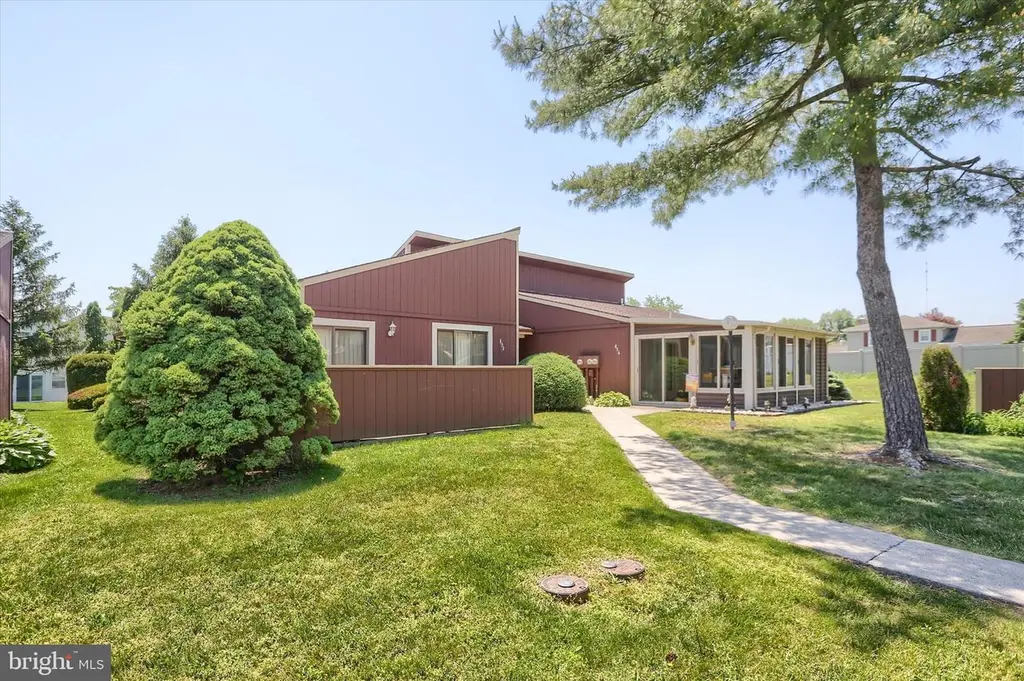
854 Melissa Ct · Enola, PA
Flood risk No data
- FEMA flood zone
- —
- Chance of flooding over 30 yrs
- —
- Est. flood insurance / yr
- —
Fire risk No data
- Est. fire insurance / yr
- —
Heat risk No data
- Hot days now (above threshold)
- —
- Hot days in 30 yrs
- —
Wind risk No data
- Chance of severe wind over 30 yrs
- —
Air-quality risk No data
- Unhealthy air days now
- —
- Unhealthy air days in 30 yrs
- —
Risk factors via First Street. Map © Google.
Why this score? — see what drove the D+ grade
The composite is a weighted blend of 9 inputs, each scored 0–100. Each bar is that input's sub-score; the figure is the points it added to the 100-point composite (weight × sub-score).
- ARV discount +15.0/15.0
- Cash flow +9.6/30.0
- 1% rule +7.2/10.0
- Rent growth +4.1/5.0
- Livability +4.0/5.0
- Schools +3.8/10.0
- DSCR +2.7/10.0
- Condition / age +2.5/5.0
- Appreciation +0.0/10.0
$129,900
🖨 Deal sheet (PDF) 📄 Offer letter ✓ Due diligence
Listing remarks
Enjoy easy, maintenance-free living in this 2-bedroom, 2-full bath condo located in the newer section of Westwood Village. The open living room/dining room has a skylight and 2 ceiling fans. The eat-in kitchen has ample storage. . . and all the appliances convey! The spacious primary suite features a walk-in closet and private full bath with walk-in shower. Additional highlights include first-floor living, extra wide doorways and hallway, private patio, outdoor storage shed, and the refrigerator, washer and dryer are conveying with the sale. NEW HVAC system installed in 2019. The HOA offers an impressive array of amenities and services, including roof and siding maintenance, lawn care, snow
Key facts
- $431 HOA
- Parking
- Community pool
Property features AI
Finance
- Other: Property manager present; Not in a federal flood zone; Pets allowed (cats and dogs permitted)
- HOA & community: Monthly condo fee; Professional off-site management; Condo fee covers common area maintenance, exterior building maintenance, insurance, lawn maintenance, management, pest control, pool(s), recreation facility, and snow removal; Community amenities include clubhouse, extra storage, party room, outdoor pool, recreation center, reserved/assigned parking, and tennis courts
Exterior
- Parking: One assigned parking space (space #854); Assigned parking and handicap parking available; Parking lot / off-street parking
- Utilities: Public water; Public sewer; Municipal trash service
- Home design: Condominium, end-of-row townhouse; Single-level living (main floor bedrooms and laundry)
- Construction: T-1-11 exterior; Architectural shingle roof; Slab foundation; Estimated year built
- Exterior features: Secure storage; Sidewalks; Tennis courts; Patio(s); Community pool; Storage barn/shed
Interior
- Kitchen: Dishwasher; Electric range/oven; Refrigerator; Eat-in kitchen
- Bedrooms: Two bedrooms on the main level
- Bathrooms: Two full bathrooms (one is a master bath)
- Heating & cooling: Forced air heating with electric heat pump backup; Electric heating fuel; Central air conditioning; Ceiling fans
- Interior features: Stall shower and tub/shower combination; Ceiling fans; Chair railings; Crown moldings; Eat-in kitchen; Master bath; Skylights; Walk-in closets; Combination dining and living area
- Laundry & utility: Washer and dryer on the main floor; Electric water heater
Neighborhood map
What this means for you Summary
Snapshot
- This is a 2-bed/2.0-bath townhouse listed at $130k.
Deal economics
- At list price, monthly cash flow is $-88 ($-1k/yr) — negative.
- To cash-flow at today's rent, offer at most $114k (12.0% below list).
- Meets the 1% rule at list price ($2k rent vs $130k).
- Recommended offer: $114k (12.0% below list) — sets the bar for cash-flow.
- Cap rate 5.5% vs local median 3.4% in Enola — top-decile yield for the area; either an underpriced asset or a hidden risk that comps aren't pricing in. Stress-test before assuming the spread holds.
Location & tenants
- Location reads 79/100 on livability (#243 in PA, #2,077 nationally) — a middle-class / working-renter tenant base. Strengths: cost of living A+, housing A+, health & safety A+; Watch: employment C-, commute D+, amenities F.
- East Pennsboro Area SD (suburban): math 30% / reading 57% proficiency, ranked #275 of 539 in PA (top 51%) — families likely to look elsewhere, expect single-tenant / working-renter base with shorter leases.
- Zoned schools: East Pennsboro El Sch (math 35% / reading 53%, grade F, #858 of 1,518 statewide, top 57%, 588 students, 50% FRL); East Pennsboro Area Ms (math 14% / reading 56%, grade F, #322 of 512 statewide, top 64%, 563 students, 50% FRL); East Pennsboro Area Shs (math 82% / reading 72%, grade A-, #22 of 437 statewide, top 5%, 761 students, 36% FRL) — zoned schools average 45% FRL vs 24% district-wide (21 pts higher); higher-poverty schools than district average — tighter screening recommended.
- Market conditions: Rents rising fast (+6.5%/yr); 131 active listings in the ZIP; 6 comparable units currently listed for rent nearby; rentals at typical pace (median 16d on market — plan ~3-4 weeks tenant-placement turnaround); solid renter incomes; 1,052 units permitted in Cumberland County in 2024 (310 in 5+ unit buildings).
Forward outlook
- Local home prices are declining (-3.0%/yr); year-one equity from $898 of loan paydown is wiped out by about $4k of value loss. Plan a longer hold.
- Cumberland County population projected at +17% by 2050 — long-run rental-demand tailwind backs the buy-and-hold thesis.
Negotiation context
- Only 3 days on market — expect competitive offers; lowballing is unlikely to land.
- Current owner paid $110k; 18% above their basis — modest negotiation headroom, anchor on the comps not their cost.
Risks & watch-outs
- Watch-outs: HOA is 27% of rent.
Questions for the listing agent
- What do current leases actually rent for vs. the listed asking? Can we see a recent rent roll and the last 12 months of T-12 income?
- What does the HOA fee cover, when was the last increase, and are there any pending special assessments or reserve-fund shortfalls?
- Is there a deadline driving the sale (1031 exchange, divorce, estate, relocation)? That informs how much negotiation room exists.
- Schools are B-rated — typically a magnet for longer-tenancy family renters. What's the average tenant stay here, and is there a school-zone premium baked into asking?
- The area grade is low — what's the realistic commute time and amenity access for the typical tenant pool here? Any planned neighborhood developments (good or bad) we should know about?
- What's the average days-on-market for RENTAL listings here right now (not sales)? A rising rental-DOM trend means longer vacancies and softer asking-rent achievability than the comps imply.
- What's the recent tenant-quality profile in this submarket — average credit score on applications, eviction rate, late-payment / NSF rate, and stable-employment percentage? A property-management company in the area should have these aggregated.
- How much new for-sale + rental construction is in the pipeline within 1–3 miles? Heavy new supply typically softens prices + rents 12–24 months out; constrained supply supports both.
Investment metrics
- 1% rule
- 1.22% ✓
- Cap rate
- 5.48%
- Cash-on-cash
- -2.91%
- DSCR
- 0.87
- GRM
- 6.8
CMA / ARV
- ARV (on-the-fly)
- $165,000
- Comps found
- 12
Show comp detail 12 sales within ~0.75 mi
| Address | Dist | Beds/Ba | Sqft | Sold | Price | $/sf | Match |
|---|---|---|---|---|---|---|---|
| 835 Charlotte Way | 0.13mi | 2/2.0 | 1,100 (0%) | 4mo | $150,000 | $136 | 90 |
| 819 Brian Dr | 0.20mi | 2/2.0 | 1,094 (-0%) | 2mo | $155,000 | $142 | 88 |
| 847 Brian Dr | 0.21mi | 2/2.0 | 1,138 (+4%) | 4mo | $149,900 | $132 | 81 |
| 810 Charlotte Way #303 | 0.10mi | 2/2.0 | 1,166 (+6%) | 7mo | $120,000 | $103 | 80 |
| 810 Charlotte Way #202 | 0.10mi | 2/2.0 | 1,166 (+6%) | 8mo | $143,000 | $123 | 78 |
| 821 Lee Ln | 0.18mi | 2/2.0 | 990 (-10%) | 3mo | $148,500 | $150 | 73 |
| 818 Charlotte Way | 0.09mi | 2/2.0 | 980 (-11%) | 8mo | $165,000 | $168 | 71 |
| 851 Louise Ct | 0.15mi | 2/2.0 | 980 (-11%) | 7mo | $149,900 | $153 | 69 |
| 836 Lee Ln | 0.16mi | 2/2.0 | 980 (-11%) | 8mo | $160,000 | $163 | 68 |
| 107 Melissa Ct | 0.03mi | 3/3.0 (+1) | 1,235 (+12%) | 7mo | $180,000 | $146 | 64 |
| 638 Gates Ln | 0.44mi | 2/1.5 | 1,008 (-8%) | 9mo | $179,900 | $178 | 56 |
| 36 Woodmyre Ln | 0.22mi | 3/1.5 (+1) | 1,246 (+13%) | 10mo | $255,000 | $205 | 52 |
Match score weights: distance 35% · size 25% · config 20% · recency 20%. Top-matched comps best support the ARV.
Projected returns pro-forma
-3.0% appreciation · 6.46% rent growth · sell at horizon
- IRR
- -15.2%
- Equity multiple
- 0.43×
- Total profit
- $-20,675
- Equity at exit
- $19,369
- IRR
- 0.3%
- Equity multiple
- 1.03×
- Total profit
- $1,063
- Equity at exit
- $11,231
Cash invested: $36,372 (down + closing). Projections, not guarantees.
Landlord ↔ Tenant lean methodology
- Overall (STATE)
- 62 Landlord-Friendly
- State Pennsylvania
- 62 Landlord-Friendly · EVEN
- County
- — inherits STATE
- City
- — inherits STATE
ZIP-level market 17025
- Home prices YoY
- -25.3%
- Rents YoY
- 6.5%
- Active inventory
- 131
- Price-to-rent
- 6.8×
Monthly cashflow live
- Estimated rent
- $1,582 high interval (Pro) →
- Mortgage (P&I)
- −$681
- Tax from tax record
- −$171 /mo · $2,057/yr
- Insurance
- −$54
- HOA
- −$431
- Vacancy / Maint / Mgmt
- −$332
- Net cashflow
- $-88
Break-even live
Sensitivity live
| Price | -10% $-15 | -5% $-51 | +0% $-88 | +5% $-125 | +10% $-162 |
|---|---|---|---|---|---|
| Rent | -10% $-213 | -5% $-151 | +0% $-88 | +5% $-26 | +10% $37 |
| Rate | -1.0pp $-23 | -0.5pp $-55 | base $-88 | +0.5pp $-122 | +1.0pp $-156 |
UW: 25.0% down · 7.5% · 30yr · 1.5% tax · 5.0% vac · 8.0% maint · 8.0% mgmt
Financing live
Cash to close
- Down payment
- $32,475
- Closing costs
- $3,897
- Reserves months
- —
- Total cash needed
- —
Loan-product check · same deal, 3 products live
Conventional
25% down · 7.5% · 30yr
- Down + closing
- —
- Monthly P&I
- —
- Monthly cashflow
- —
- DSCR
- —
- Eligible?
- —
Personal DTI + credit; lowest rate.
DSCR
20% down · 8.5% · 30yr
- Down + closing
- —
- Monthly P&I
- —
- Monthly cashflow
- —
- DSCR
- —
- Eligible?
- —
No personal income docs; deal must DSCR.
Hard money
10% down · 12.0% · 12mo
- Down + closing
- —
- Monthly P&I
- —
- Monthly cashflow
- —
- DSCR
- —
- Eligible?
- —
Short-term bridge; refi at stabilization.
Rent comps 6 comps
| Address | Beds | Baths | Sqft | Rent | $/sqft | DOM | Units | Dist |
|---|---|---|---|---|---|---|---|---|
| 115 Charlotte Way #303 Enola, PA | 2.0 | 2.0 | 1166 | $1,450 | $1.24 | 16d | 1 | 0.12mi |
| 64 Queen Ave Enola, PA | 2.0 | 1.5 | 1200 | $1,495 | $1.25 | 16d | 1 | 0.91mi |
| 3 Silk Mill Dr East Pennsboro Township, PA | 2.0 | 1.0–2.0 | 1319 | $1,822 | $1.38 | 16d | 8 | 1.06mi |
| 3701 Lilac Ln Enola, PA | 1.0–3.0 | 1.0–2.0 | 1290 | $1,885 | $1.46 | 16d | 25 | 1.34mi |
| 2305 Hadley Blvd Unit 106 Enola, PA | 1.0 | 1.0 | 847 | $1,629 | $1.92 | 16d | 1 | 1.40mi |
| 2320 Hadley Blvd Unit 108 Enola, PA | 1.0 | 1.0 | 744 | $1,542 | $2.07 | 16d | 1 | 1.45mi |
HOA detail
- Monthly dues
- $431 · $5,172/yr
- Likely covers
- landscaping
Listing history 6 events
-
2026-06-01status $129,900 Pending 3 DOM
-
2026-05-31days on market $129,900 Active 3 DOM
-
2026-05-31days on market $129,900 Active 2 DOM
-
2026-05-22historical $129,900
-
2024-03-22soldstatus $110,000
-
1989-08-28soldstatus $59,900
ⓘ Source: listings_history table (triggers on properties + properties_extension) + one-shot
backfill from property_details.listing_events for pre-trigger history.
Tax reassessment forecast PA · Partial reset (capped growth)
- Current annual tax
- $2,057 · $171/mo
- Projected year-2 tax
- $2,057 · $171/mo
- Expected delta
- $0/yr ($0/mo · 0.0%)
ⓘ Screening estimate from a state-policy table — verify with the county assessor before closing.
Nearby sold comps map
Loading sold comps map…
Walkable amenities ~0.75 mi
Loading nearby amenities…
Taxation est. · year 1
- Rental income
- $18,981
- − Mortgage interest
- −$7,276
- − Property taxes
- −$2,057
- − Insurance
- −$650
- − Repairs & maintenance
- −$1,518
- − Management
- −$1,518
- − HOA
- −$5,172
- − Depreciation
- −$3,779
- Taxable loss
- −$2,990
- Est. tax savings @ 24.0%
- +$718
- After-tax cash flow
- $-341/yr
For passive investors: Depreciation is non-cash, so a rental often shows a tax loss while cash-flowing — sheltering income. Rental losses are passive: they offset passive income freely, and up to $25,000/yr can offset ordinary (W-2) income if you actively participate and your MAGI is under $100k (phasing out to $0 by $150k); unused losses carry forward. On sale, claimed depreciation is recaptured at up to 25%, and gains may owe capital-gains tax (a 1031 exchange can defer both). Figures are a year-1 estimate at your 24.0% rate — not tax advice; consult a CPA.
Schools (NCES district)
- District
- East Pennsboro Area SD
- NCES district ID
- 4208580
- Math proficiency
- 30% ▼ -16.00%
- Reading proficiency
- 57% ▼ -8.00%
- Median HH income
- $60,120
- Composite
- 38.26/100
- National rank
- #4239
- State rank
- #275 of 539 in PA
Livability — Enola
- Score
- 79/100
- State rank
- #243
- US rank
- #2077
Category grades
Schools grade is shown separately in the Schools card above.
Census & demographics
- County
- Cumberland County · 257,673 people
- City population
- 17,648
- Metro
- Harrisburg-Carlisle, PA
- Population (ZIP)
- 17,648
- Household income
- $91,285
- Rent vs Own
- Severe rent burden
- 317.0
Population outlook (Cumberland County) Hauer SSP2
- Today (2025)
- 267,950 people
- By 2030
- 278,105 · +3.8%
- By 2040
- 296,552 · +10.7%
- By 2050
- 312,937 · +16.8%
- By 2075
- 349,233 · +30.3%
- By 2100
- 361,875 · +35.1%
Race, ethnicity, and origin ACS 2023
- Neighborhood character
- Predominantly White (79%)
- Race & ethnicity
- White 79% Hispanic / Latino 6% Asian 6% Two or more races 6% Black 3%
- Hispanic origin (detail)
- Puerto Rican 2% Dominican 2%
- Common ancestry
- Romanian 3% Italian 2% Slovak 2%
- Foreign-born
- 8% · Canada, South Korea, Vietnam
- Languages at home
- 88% English-only · Other Indo-European 5% Spanish 4% Tagalog/Filipino 1%
Political lean MEDSL · Cumberland
- 2024 margin
- Lean R (+9.4) · D 44.6% · R 54.1% · Other 1.3%
- 2008→2024 swing
- +4.2pp toward D · 2008: -13.6pp · 2024: -9.4pp
- All cycles
- 2024: R+9.4 2020: R+10.6 2016: R+18.6 2012: R+18.5 2008: R+13.6
Not yet ingested
- Civics
- —
Market trends
- HPI YoY
- ▼ -85.21%
- Current HPI
- 251.939
- Rent YoY
- ▲ 6.46%
- Metro
- Harrisburg-Carlisle, PA
- State GDP YoY
- ▲ 1.68%
- F500 in state
- 34
Industry mix (Fortune 500 HQ in PA)
| Industry | F500 HQs | Revenue |
|---|---|---|
| Healthcare | 2 | $309B |
|
||
| Insurance | 2 | $27B |
|
||
| Telecommunications / Media | 1 | $124B |
|
||
| Industrial Distribution | 1 | $22B |
|
||
| Financial Services | 1 | $20B |
|
||
| Chemicals / Materials | 1 | $18B |
|
||
Price history
+116.9% since first listed5 events — show timeline
- 2026-06-01 Pending — BRIGHT MLS
- 2026-05-29 Listed $129,900 BRIGHT MLS
- 2026-05-22 Coming Soon $129,900 BRIGHT MLS
- 2024-03-22 Sold (Public Records) $110,000 Public Records
- 1989-08-28 Sold (Public Records) $59,900 Public Records
Property tax history
+3.4%/yrLatest (2026): $2,057 · +1.8% YoY. Source: county tax records.
Cash-flow waterfall
monthlySold comps — $/sqft
last 12 mo · ≤1 miLoading sold comps…