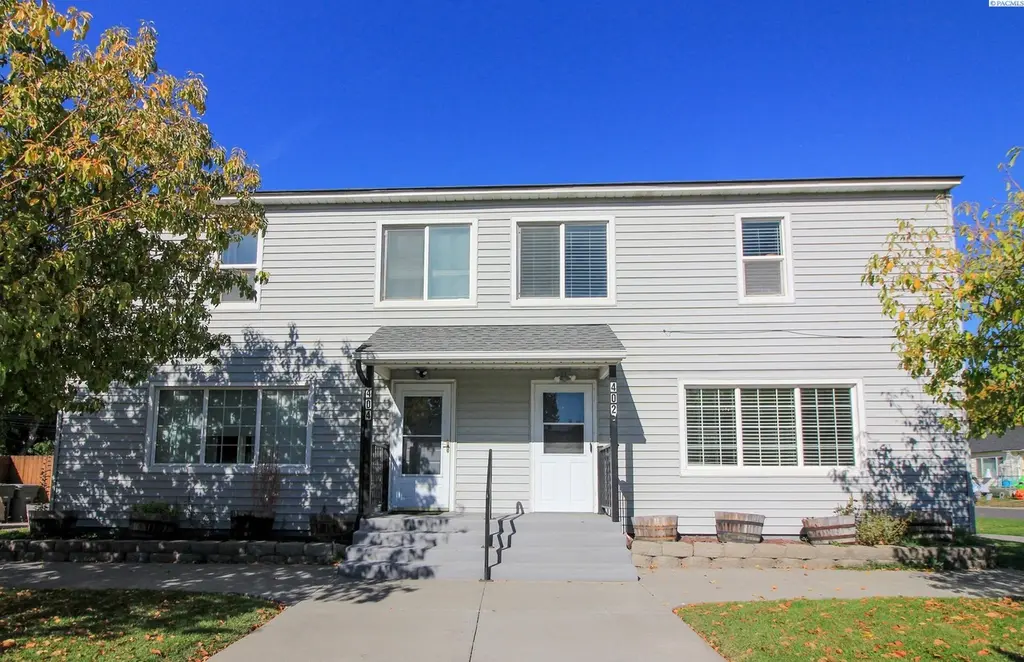
402 Benham St
Richland, WA 99352
$1,425D+
3 bd · 2.0 ba ·
2,914 sqft ·
Built 1944
· MultiFamily
· Active
· 27 DOM
Cashflow @ list (25.0% down · 7.5%)
Estimated rent
$3,931/mo
Mortgage (P&I)
−$7
Tax + insurance
−$2
HOA
−$0
Vac / Maint / Mgmt
−$826
Net cashflow
$3,096/mo
Annual
$37,148/yr
Cap rate
2613.15%
Cash-on-cash
9310.20%
DSCR
415.25
1% rule
275.86%
Cash to close
$399
Investor read
- This is a 2 × 3-bed/1.0-bath units multifamily listed at $1k.
- At list price, monthly cash flow is $3k ($37k/yr) — positive. Per door: $2k/mo.
- The deal already cash-flows at list — no discount required.
- Meets the 1% rule at list price ($4k rent vs $1k).
- It's been on market 27 days — a 2% lower offer ($1k) is reasonable based on typical stale-listing flexibility.
- Recommended offer: $1k (1.5% below list) — sets the bar for market timing.
- Local home prices are declining (-3.0%/yr); year-one equity from $10 of loan paydown is wiped out by about $43 of value loss. Plan a longer hold.
- Location reads 79/100 on livability (#112 in WA, #2,258 nationally) — a middle-class / working-renter tenant base. Strengths: commute A+, housing A+, health & safety A+; Watch: cost of living C-, amenities F.
- Richland School District (urban): math 52% / reading 64% proficiency, ranked #61 of 291 in WA (top 21%) — acceptable for families but not a draw, mixed tenant base, ~2y average lease.
- Watch-outs: built in 1944 — expect roof / HVAC / electrical / plumbing capex.
- Market conditions: Rents rising (+1.6%/yr); 544 active listings in the ZIP; 2 comparable units currently listed for rent nearby; solid renter incomes; 1,532 units permitted in Benton County in 2024 (389 in 5+ unit buildings).
- Benton County population projected at +32% by 2050 — long-run rental-demand tailwind backs the buy-and-hold thesis.
- At projected returns (-3.0% appreciation + 1.6% rent growth), your $399 cash investment doubles in ~1 year — after that, you're playing with house money.
- Climate carrying-cost: extreme-heat days projected 7→15/yr by 2055 (HVAC capex compounding) — expect insurance premiums to compound above CPI over the hold.
- Cap rate 2613.1% vs local median 2.8% in Richland — top-decile yield for the area; either an underpriced asset or a hidden risk that comps aren't pricing in. Stress-test before assuming the spread holds.
- At $3,931/mo this rent would consume 47% of the median local household income ($100k/yr) (locally 983% of renters already pay >50% of income on rent) — very limited rent-growth headroom before tenants either downsize or default.
Questions for listing agent
- Can we see the unit-by-unit rent roll, current vacancy, and any below-market leases? What's the average tenancy length?
- What capital expenditures (roof, boiler, parking lot, exteriors) have been made in the last 5 years, and what's planned in the next 2?
- Built in 1944 — when were the roof, HVAC, electrical panel, plumbing, and water heater last replaced?
- Is there a deadline driving the sale (1031 exchange, divorce, estate, relocation)? That informs how much negotiation room exists.
- Schools are A-rated — typically a magnet for longer-tenancy family renters. What's the average tenant stay here, and is there a school-zone premium baked into asking?
- The area grade is low — what's the realistic commute time and amenity access for the typical tenant pool here? Any planned neighborhood developments (good or bad) we should know about?
- What's the average days-on-market for RENTAL listings here right now (not sales)? A rising rental-DOM trend means longer vacancies and softer asking-rent achievability than the comps imply.
- What's the recent tenant-quality profile in this submarket — average credit score on applications, eviction rate, late-payment / NSF rate, and stable-employment percentage? A property-management company in the area should have these aggregated.
CashFlowRE · CFR-EV8PHDB7P9DJSF
· Data 2 weeks ago
cashflowre.app · 2026-05-29