 🏷️ Likely Rental
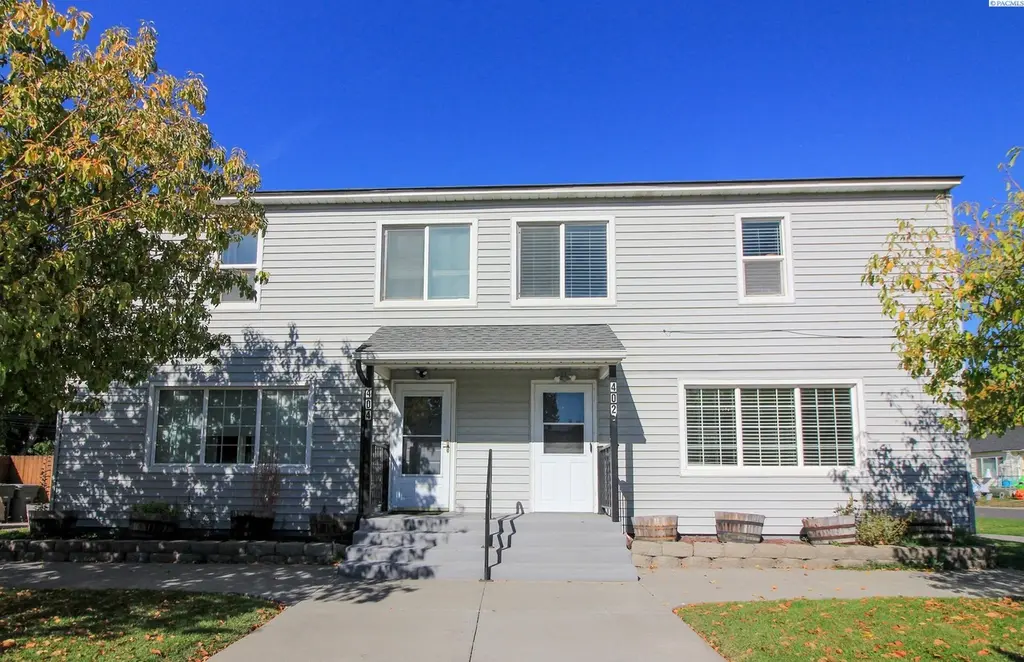
402 Benham St · Richland, WA
Flood risk 1/10 · Minimal
- FEMA flood zone
- X
- Chance of flooding over 30 yrs
- 0.0%
- Est. flood insurance / yr
- $473 – $860
Fire risk 1/10 · Minimal
- Est. fire insurance / yr
- $604 – $1,122
Heat risk 5/10 · Moderate
- Hot days now (above 99°F)
- 7 days/yr
- Hot days in 30 yrs
- 15 days/yr
Wind risk 1/10 · Minimal
- Chance of severe wind over 30 yrs
- —
Air-quality risk 7/10 · Major
- Unhealthy air days now
- 11 days/yr
- Unhealthy air days in 30 yrs
- 12 days/yr
Risk factors via First Street. Map © Google.
Why this score? — see what drove the D+ grade
The composite is a weighted blend of 9 inputs, each scored 0–100. Each bar is that input's sub-score; the figure is the points it added to the 100-point composite (weight × sub-score).
- Cash flow +15.0/30.0
- ARV discount +7.5/15.0
- Schools +5.3/10.0
- 1% rule +5.0/10.0
- DSCR +5.0/10.0
- Livability +4.0/5.0
- Rent growth +2.9/5.0
- Condition / age +2.5/5.0
- Appreciation +0.0/10.0
$1,425
🖨 Deal sheet 📄 Offer letter ✓ Due diligence
Multi-family units
County records classify this as Multi-Family (2-4 Unit). Listing-text estimate: 2 units. confirmed
Listing remarks
We do not accept 3rd party applications or viewing requests. 3 Bedrooms, 1 Bath 1457 sqft Home in Central Richland This well-maintained 3-bedroom, 1-bath duplex in Central Richland offers 1,457 sq ft of comfortable living space with a thoughtful layout. The main floor features durable hard-surface flooring and an inviting living area filled with natural light. The kitchen provides ample cabinet and counter space, along with a pantry for added storage and a convenient portable dishwasher topped with a butcher block surface. All three bedrooms are located upstairs. The full bathroom has been tastefully updated and includes a fully tiled shower and newer vanity. The basement adds significant
Key facts
- Built 1944
- Listed 26 days
Neighborhood map
What this means for you Summary
Snapshot
- This is a 2 × 3-bed/1.0-bath units multifamily listed at $1k.
Deal economics
- At list price, monthly cash flow is $3k ($37k/yr) — positive. Per door: $2k/mo.
- The deal already cash-flows at list — no discount required.
- Meets the 1% rule at list price ($4k rent vs $1k).
- Recommended offer: $1k (1.5% below list) — sets the bar for market timing.
- Cap rate 2613.1% vs local median 2.8% in Richland — top-decile yield for the area; either an underpriced asset or a hidden risk that comps aren't pricing in. Stress-test before assuming the spread holds.
Location & tenants
- Location reads 79/100 on livability (#112 in WA, #2,258 nationally) — a middle-class / working-renter tenant base. Strengths: commute A+, housing A+, health & safety A+; Watch: cost of living C-, amenities F.
- Richland School District (urban): math 52% / reading 64% proficiency, ranked #61 of 291 in WA (top 21%) — acceptable for families but not a draw, mixed tenant base, ~2y average lease.
- Market conditions: Rents rising (+1.6%/yr); 544 active listings in the ZIP; 2 comparable units currently listed for rent nearby; solid renter incomes; 1,532 units permitted in Benton County in 2024 (389 in 5+ unit buildings).
- At $3,931/mo this rent would consume 47% of the median local household income ($100k/yr) (locally 983% of renters already pay >50% of income on rent) — very limited rent-growth headroom before tenants either downsize or default.
Forward outlook
- Local home prices are declining (-3.0%/yr); year-one equity from $10 of loan paydown is wiped out by about $43 of value loss. Plan a longer hold.
- Benton County population projected at +32% by 2050 — long-run rental-demand tailwind backs the buy-and-hold thesis.
- At projected returns (-3.0% appreciation + 1.6% rent growth), your $399 cash investment doubles in ~1 year — after that, you're playing with house money.
Negotiation context
- It's been on market 27 days — a 2% lower offer ($1k) is reasonable based on typical stale-listing flexibility.
Risks & watch-outs
- Watch-outs: built in 1944 — expect roof / HVAC / electrical / plumbing capex.
- Climate carrying-cost: extreme-heat days projected 7→15/yr by 2055 (HVAC capex compounding) — expect insurance premiums to compound above CPI over the hold.
Questions for the listing agent
- Can we see the unit-by-unit rent roll, current vacancy, and any below-market leases? What's the average tenancy length?
- What capital expenditures (roof, boiler, parking lot, exteriors) have been made in the last 5 years, and what's planned in the next 2?
- Built in 1944 — when were the roof, HVAC, electrical panel, plumbing, and water heater last replaced?
- Is there a deadline driving the sale (1031 exchange, divorce, estate, relocation)? That informs how much negotiation room exists.
- Schools are A-rated — typically a magnet for longer-tenancy family renters. What's the average tenant stay here, and is there a school-zone premium baked into asking?
- The area grade is low — what's the realistic commute time and amenity access for the typical tenant pool here? Any planned neighborhood developments (good or bad) we should know about?
- What's the average days-on-market for RENTAL listings here right now (not sales)? A rising rental-DOM trend means longer vacancies and softer asking-rent achievability than the comps imply.
- What's the recent tenant-quality profile in this submarket — average credit score on applications, eviction rate, late-payment / NSF rate, and stable-employment percentage? A property-management company in the area should have these aggregated.
- How much new apartment / multifamily construction is in the pipeline within 1–3 miles? Heavy new supply (>2% of stock underway) typically softens rents 12–24 months out; light construction supports rent growth.
Investment metrics
- 1% rule
- 275.86% ✓
- Cap rate
- 2613.15%
- Cash-on-cash
- 9310.20%
- DSCR
- 415.25
- GRM
- 0.0
CMA / ARV
- ARV (median comp)
- $398,957
- List price
- $1,425
- Delta
- -99.64%
- Verdict
- UNDERPRICED
- Comps
- 8 within 1.0 mi
Show comp detail 5 sales within ~0.75 mi
| Address | Dist | Beds/Ba | Sqft | Sold | Price | $/sf | Match |
|---|---|---|---|---|---|---|---|
| 312/314 Bernard Ave | 0.24mi | 4/2.0 (+1) | 3,175 (+9%) | 5mo | $431,200 | $136 | 65 |
| 324 Delafield Ave | 0.46mi | 3/2.0 | 2,800 (-4%) | 10mo | $460,000 | $164 | 63 |
| 220 Cullum Ave #222 | 0.34mi | 4/2.0 (+1) | 3,200 (+10%) | 0mo | $469,750 | $147 | 62 |
| 400/402 Barth Ave | 0.31mi | 4/3.0 (+1) | 3,242 (+11%) | 8mo | $525,000 | $162 | 52 |
| 311 Casey Ave | 0.31mi | 4/3.0 (+1) | 2,478 (-15%) | 2mo | $450,000 | $182 | 50 |
Match score weights: distance 35% · size 25% · config 20% · recency 20%. Top-matched comps best support the ARV.
Projected returns pro-forma
-3.0% appreciation · 1.6% rent growth · sell at horizon
- IRR
- —
- Equity multiple
- 481.03×
- Total profit
- $191,530
- Equity at exit
- $212
- IRR
- —
- Equity multiple
- 1001.28×
- Total profit
- $399,113
- Equity at exit
- $123
Cash invested: $399 (down + closing). Projections, not guarantees.
Landlord ↔ Tenant lean methodology
- Overall (STATE)
- 28 Tenant-Leaning
- State Washington
- 28 Tenant-Leaning · D+8
- County
- — inherits STATE
- City
- — inherits STATE
ZIP-level market 99352
- Rents YoY
- 1.6%
- Active inventory
- 544
- Price-to-rent
- 0.1×
Monthly cashflow live
- Estimated rent
- $3,931 high interval (Pro) →
- Mortgage (P&I)
- −$7
- Tax est. 1.5%
- −$2 /mo · $21/yr
- Insurance
- −$1
- HOA
- −$0
- Vacancy / Maint / Mgmt
- −$826
- Net cashflow
- $3,096
Break-even live
2-unit breakdown (identical units grouped — click to expand)
| Units | Beds | Baths | Est. rent |
|---|---|---|---|
| 2× units | 3 | 1 | $3,932 |
| #1 | 3 | 1 | $1,966 |
| #2 | 3 | 1 | $1,966 |
| Total (2 units) | $3,931 | ||
UW: 25.0% down · 7.5% · 30yr · 1.5% tax · 5.0% vac · 8.0% maint · 8.0% mgmt
Financing live
Cash to close
- Down payment
- $356
- Closing costs
- $43
- Reserves months
- —
- Total cash needed
- —
Loan-product check · same deal, 3 products live
Conventional
25% down · 7.5% · 30yr
- Down + closing
- —
- Monthly P&I
- —
- Monthly cashflow
- —
- DSCR
- —
- Eligible?
- —
Personal DTI + credit; lowest rate.
DSCR
20% down · 8.5% · 30yr
- Down + closing
- —
- Monthly P&I
- —
- Monthly cashflow
- —
- DSCR
- —
- Eligible?
- —
No personal income docs; deal must DSCR.
Hard money
10% down · 12.0% · 12mo
- Down + closing
- —
- Monthly P&I
- —
- Monthly cashflow
- —
- DSCR
- —
- Eligible?
- —
Short-term bridge; refi at stabilization.
Rent comps 2 comps
| Address | Beds | Baths | Sqft | Rent | $/sqft | DOM | Units | Dist |
|---|---|---|---|---|---|---|---|---|
| 459 Columbia Point Dr Richland, WA | 3.0 | 2.5 | 2500 | $2,595 | $1.04 | 21d | 1 | 0.92mi |
| 711 Sanford Ave Richland, WA | 3.0 | 2.0 | 2304 | $1,650 | $0.72 | 44d | 1 | 1.21mi |
Listing history 8 events
-
2026-06-03days on market $1,425 Active 27 DOM
-
2026-06-02days on market $1,425 Active 26 DOM
-
2026-06-01days on market $1,425 Active 25 DOM
-
2026-05-31days on market $1,425 Active 24 DOM
-
2026-05-30days on market $1,425 Active 23 DOM
-
2026-05-07$1,425 Active 1781-char remark
-
2026-05-03$1,425
-
2019-05-22soldstatus $305,000
ⓘ Source: listings_history table (triggers on properties + properties_extension) + one-shot
backfill from property_details.listing_events for pre-trigger history.
Climate risk First Street
- Flood 1/10 Low FEMA zone X · 0% chance over 30 yrs
- Wildfire 1/10 Low
- Heat 5/10 Major 7 d/yr ≥99°F today · 15 d/yr by 30 yrs out
- Wind 1/10 Low
- Air quality 7/10 Severe 11 unhealthy d/yr today · 12 by 30 yrs out
Nearby sold comps map
Loading sold comps map…
Walkable amenities ~0.75 mi
Loading nearby amenities…
Taxation est. · year 1
- Rental income
- $47,172
- − Mortgage interest
- −$80
- − Property taxes
- −$21
- − Insurance
- −$7
- − Repairs & maintenance
- −$3,774
- − Management
- −$3,774
- − Depreciation
- −$41
- Taxable income
- $39,475
- Est. tax owed @ 24.0%
- −$9,474
- After-tax cash flow
- $27,674/yr
For passive investors: Depreciation is non-cash, so a rental often shows a tax loss while cash-flowing — sheltering income. Rental losses are passive: they offset passive income freely, and up to $25,000/yr can offset ordinary (W-2) income if you actively participate and your MAGI is under $100k (phasing out to $0 by $150k); unused losses carry forward. On sale, claimed depreciation is recaptured at up to 25%, and gains may owe capital-gains tax (a 1031 exchange can defer both). Figures are a year-1 estimate at your 24.0% rate — not tax advice; consult a CPA.
Schools (NCES district)
- District
- Richland School District
- NCES district ID
- 5307320
- Math proficiency
- 52% ▬ 0.00%
- Reading proficiency
- 64% ▼ -1.00%
- Median HH income
- $70,475
- Composite
- 53.04/100
- National rank
- #3244
- State rank
- #61 of 291 in WA
Livability — Richland
- Score
- 79/100
- State rank
- #112
- US rank
- #2258
Category grades
Schools grade is shown separately in the Schools card above.
Census & demographics
- Census place
- Richland, WA
- County
- Benton County · 186,895 people
- City population
- 62,989
- Metro
- Kennewick-Richland, WA
- Population (ZIP)
- 37,430
- Household income
- $100,108
- Rent vs Own
- Severe rent burden
- 983.0
Population outlook (Benton County) Hauer SSP2
- Today (2025)
- 219,421 people
- By 2030
- 233,813 · +6.6%
- By 2040
- 262,134 · +19.5%
- By 2050
- 290,100 · +32.2%
- By 2075
- 363,525 · +65.7%
- By 2100
- 418,667 · +90.8%
Race, ethnicity, and origin ACS 2023
- Neighborhood character
- Predominantly White (73%)
- Race & ethnicity
- White 73% Hispanic / Latino 14% Two or more races 10% Asian 7% Black 2%
- Hispanic origin (detail)
- Mexican 11%
- Common ancestry
- Italian 4% Portuguese 4% Slovak 3%
- Foreign-born
- 9% · Canada, South Korea, China
- Languages at home
- 88% English-only · Spanish 4% Other Indo-European 3% Korean 1%
Political lean MEDSL · Benton
- 2024 margin
- Strong R (+21.9) · D 37.7% · R 59.6% · Other 2.7%
- 2008→2024 swing
- +4.2pp toward D · 2008: -26.1pp · 2024: -21.9pp
- All cycles
- 2024: R+21.9 2020: R+21.0 2016: R+26.6 2012: R+27.0 2008: R+26.1
Not yet ingested
- Civics
- —
Market trends
- HPI YoY
- ▼ -323.81%
- Current HPI
- 217.3435
- Rent YoY
- ▲ 1.60%
- Metro
- Kennewick-Richland, WA
- State GDP YoY
- ▲ 4.65%
- F500 in state
- 22
Industry mix (Fortune 500 HQ in WA)
| Industry | F500 HQs | Revenue |
|---|---|---|
| Retail | 2 | $269B |
|
||
| Technology / Retail | 1 | $638B |
|
||
| Technology | 1 | $245B |
|
||
| Telecommunications | 1 | $38B |
|
||
| Food / Beverage | 1 | $36B |
|
||
| Automotive / Trucks | 1 | $34B |
|
||
Price history
-99.5% since first listed3 events — show timeline
- 2026-05-31 Rental Removed $1,425 APPFOLIO
- 2026-05-03 Listed for Rent $1,425 APPFOLIO
- 2019-05-22 Sold (Public Records) $305,000 Public Records
Property tax history
+6.9%/yrLatest (2026): $4,159 · +1.2% YoY. Source: county tax records.
Cash-flow waterfall
monthlySold comps — $/sqft
last 12 mo · ≤1 miLoading sold comps…