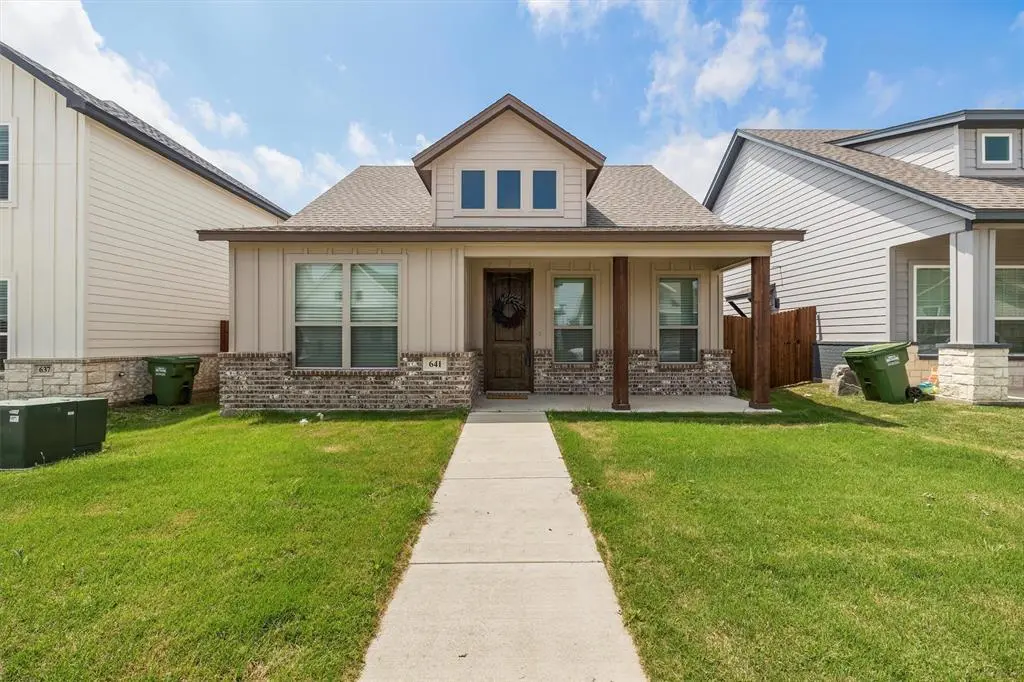
641 The Cottages Dr
Godley, TX 76044
$275,000D
3 bd · 2.0 ba ·
1,610 sqft ·
Built 2022
· SingleFamily
· Active
· 115 DOM
Cashflow @ list (25.0% down · 7.5%)
Estimated rent
$2,349/mo
Mortgage (P&I)
−$1,442
Tax + insurance
−$767
HOA
−$0
Vac / Maint / Mgmt
−$493
Net cashflow
$-353/mo
Annual
$-4,238/yr
Cap rate
4.75%
Cash-on-cash
-5.50%
DSCR
0.76
1% rule
0.85%
Cash to close
$77,000
Investor read
- This is a 3-bed/2.0-bath single-family listed at $275k. Condition is rated good.
- At list price, monthly cash flow is $-353 ($-4k/yr) — negative.
- To cash-flow at today's rent, offer at most $213k (22.7% below list).
- To meet the 1% rule (rent ≥ 1% of price), the offer needs to be $235k (14.6% below list).
- It's been on market 115 days — a 9% lower offer ($250k) is reasonable based on typical stale-listing flexibility.
- Recommended offer: $213k (22.7% below list) — sets the bar for cash-flow.
- Local home prices are declining (-3.0%/yr); year-one equity from $2k of loan paydown is wiped out by about $8k of value loss. Plan a longer hold.
- Location reads 73/100 on livability (#226 in TX) — a middle-class / working-renter tenant base. Strengths: crime A+, cost of living A+, housing A+; Watch: health & safety D+, amenities F, commute F.
- Godley ISD (rural): math 34% / reading 38% proficiency, ranked #466 of 826 in TX (top 56%) — families likely to look elsewhere, expect single-tenant / working-renter base with shorter leases.
- Zoned schools: Legacy El (math 39% / reading 37%, grade F, #1,709 of 4,322 statewide, top 40%, 408 students, 32% FRL); Godley H S (math 27% / reading 51%, grade F, #859 of 1,632 statewide, top 53%, 777 students, 42% FRL).
- Watch-outs: property tax is 2.8% of price.
- Market conditions: 570 active listings in the ZIP; 6 comparable units currently listed for rent nearby; rentals at typical pace (median 19d on market — plan ~3-4 weeks tenant-placement turnaround); 2,152 units permitted in Johnson County in 2024 (76 in 5+ unit buildings).
- Johnson County population projected at +24% by 2050 — long-run rental-demand tailwind backs the buy-and-hold thesis.
- 5 sale attempts since 4y ago with the ask held roughly flat each time — persistent listings suggest the price (not the market) is what's stuck; bring a comps-based counter.
- Cap rate 4.8% vs local median 2.8% in Godley — top-decile yield for the area; either an underpriced asset or a hidden risk that comps aren't pricing in. Stress-test before assuming the spread holds.
Questions for listing agent
- What do current leases actually rent for vs. the listed asking? Can we see a recent rent roll and the last 12 months of T-12 income?
- It's been on market 115 days. Have you received any prior offers? Is the seller open to a 23% concession, seller financing, or rate buy-down credit?
- Property tax is high relative to price — has the assessment been appealed recently, and will the sale trigger a re-assessment?
- Why hasn't it sold? Are there any deal-killer items the seller is aware of (foundation, flood, title, zoning, code violations)?
- Is there a deadline driving the sale (1031 exchange, divorce, estate, relocation)? That informs how much negotiation room exists.
- Schools are D-rated, which usually means shorter tenancies and higher turnover. Who's the typical renter profile here, and what's been the actual vacancy rate?
- The area grade is low — what's the realistic commute time and amenity access for the typical tenant pool here? Any planned neighborhood developments (good or bad) we should know about?
- What's the average days-on-market for RENTAL listings here right now (not sales)? A rising rental-DOM trend means longer vacancies and softer asking-rent achievability than the comps imply.
CashFlowRE · CFR-EVB3XPECEM6X4T
· Data 1 day ago
cashflowre.app · 2026-05-29