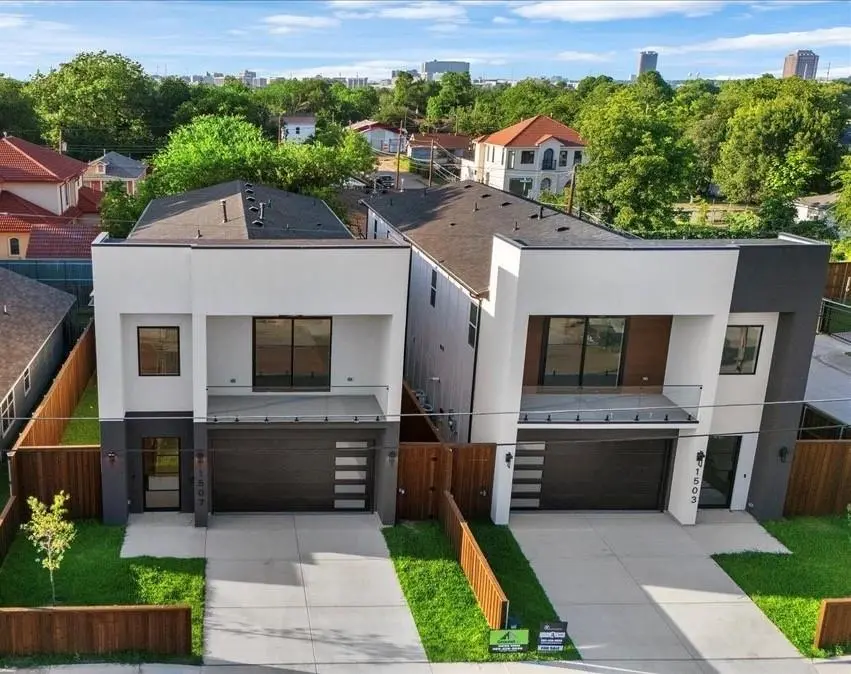
1507 Dennison St
Dallas, TX 75212
$764,995F
2 bd · 1.0 ba ·
800 sqft ·
Built 2026
· SingleFamily
· Active
· 29 DOM
Cashflow @ list (25.0% down · 7.5%)
Estimated rent
$1,602/mo
Mortgage (P&I)
−$4,012
Tax + insurance
−$847
HOA
−$0
Vac / Maint / Mgmt
−$336
Net cashflow
$-3,593/mo
Annual
$-43,121/yr
Cap rate
0.66%
Cash-on-cash
-20.13%
DSCR
0.10
1% rule
0.21%
Cash to close
$214,199
Investor read
- This is a 2-bed/1.0-bath single-family listed at $765k.
- At list price, monthly cash flow is $-4k ($-43k/yr) — negative.
- To cash-flow at today's rent, offer at most $130k (83.0% below list).
- To meet the 1% rule (rent ≥ 1% of price), the offer needs to be $160k (79.1% below list).
- It's been on market 29 days — a 2% lower offer ($754k) is reasonable based on typical stale-listing flexibility.
- Recommended offer: $130k (83.0% below list) — sets the bar for cash-flow.
- In year one you build about $82k of equity ($5k loan paydown + $76k appreciation (10.0% local appreciation)).
- Location reads 81/100 on livability (#24 in TX, #1,380 nationally) — a professional / high-income tenant draw. Strengths: amenities A+, commute A+, housing A+; Watch: crime F.
- Dallas ISD (urban): math 31% / reading 36% proficiency, ranked #559 of 826 in TX (top 68%) — families likely to look elsewhere, expect single-tenant / working-renter base with shorter leases; 83% free/reduced lunch — lower-income household profile, screen leases tightly.
- Zoned schools: C F Carr El (math 32% / reading 22%, grade F, #2,791 of 4,322 statewide, top 68%, 281 students, 99% FRL) — zoned schools average 99% FRL vs 83% district-wide (16 pts higher); higher-poverty schools than district average — tighter screening recommended.
- Market conditions: Rents falling (-4.2%/yr); 249 active listings in the ZIP; 40 comparable units currently listed for rent nearby; rentals at typical pace (median 22d on market — plan ~3-4 weeks tenant-placement turnaround); 42% of comp listings sitting > 30 days — soft ceiling on asking rent; 12,577 units permitted in Dallas County in 2024 (6,829 in 5+ unit buildings).
- Dallas County population projected at +35% by 2050 — long-run rental-demand tailwind backs the buy-and-hold thesis.
- 3 sale attempts since 2y ago with the ask held roughly flat each time — persistent listings suggest the price (not the market) is what's stuck; bring a comps-based counter.
- By year 2, paydown + projected appreciation supports a ~$131k cash-out refi (75% LTV) — recoverable capital for the next deal without selling this one.
- Climate carrying-cost: major wind risk, 27% chance of damaging wind over 30y; extreme-heat days projected 7→23/yr by 2055 (HVAC capex compounding) — expect insurance premiums to compound above CPI over the hold.
- Cap rate 0.7% vs local median 2.3% in Dallas — below-typical yield; the buyer is paying a premium for something (appreciation thesis, condition, location) that the cap rate doesn't capture.
- This rent runs 32% of the median local income ($60k/yr) — at the standard rent-burdened threshold; future hikes will face affordability resistance.
Questions for listing agent
- What do current leases actually rent for vs. the listed asking? Can we see a recent rent roll and the last 12 months of T-12 income?
- Is there a deadline driving the sale (1031 exchange, divorce, estate, relocation)? That informs how much negotiation room exists.
- Crime grade is F in this area — have there been break-ins, vandalism, or insurance claims at this property in the last 3 years? What carrier currently insures it and at what premium?
- The area grade is low — what's the realistic commute time and amenity access for the typical tenant pool here? Any planned neighborhood developments (good or bad) we should know about?
- What's the average days-on-market for RENTAL listings here right now (not sales)? A rising rental-DOM trend means longer vacancies and softer asking-rent achievability than the comps imply.
- What's the recent tenant-quality profile in this submarket — average credit score on applications, eviction rate, late-payment / NSF rate, and stable-employment percentage? A property-management company in the area should have these aggregated.
- How much new for-sale + rental construction is in the pipeline within 1–3 miles? Heavy new supply typically softens prices + rents 12–24 months out; constrained supply supports both.
CashFlowRE · CFR-EX5DSQ0B6XM2SF
· Data 2 days ago
cashflowre.app · 2026-05-29