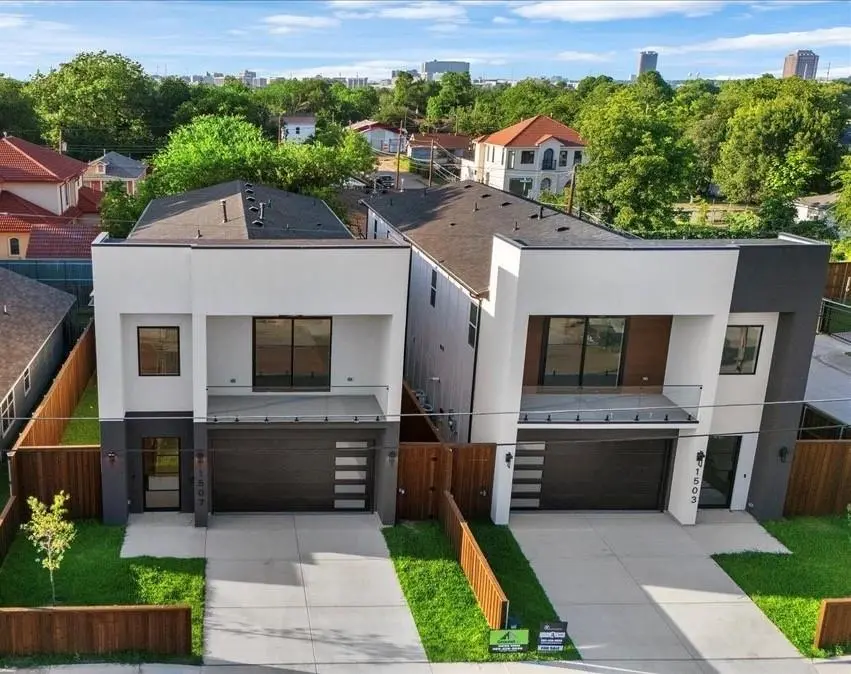
1507 Dennison St · Dallas, TX
Flood risk 1/10 · Minimal
- FEMA flood zone
- X
- Chance of flooding over 30 yrs
- 0.0%
- Est. flood insurance / yr
- $507 – $1,088
Fire risk 1/10 · Minimal
- Est. fire insurance / yr
- $1,222 – $2,270
Heat risk 7/10 · Major
- Hot days now (above 109°F)
- 7 days/yr
- Hot days in 30 yrs
- 23 days/yr
Wind risk 6/10 · Moderate
- Chance of severe wind over 30 yrs
- 27.0%
Air-quality risk 3/10 · Minor
- Unhealthy air days now
- 2 days/yr
- Unhealthy air days in 30 yrs
- 3 days/yr
Risk factors via First Street. Map © Google.
Why this score? — see what drove the F grade
The composite is a weighted blend of 9 inputs, each scored 0–100. Each bar is that input's sub-score; the figure is the points it added to the 100-point composite (weight × sub-score).
- Appreciation +10.0/10.0
- ARV discount +7.5/15.0
- Livability +4.0/5.0
- Schools +2.8/10.0
- Condition / age +2.5/5.0
- Rent growth +1.4/5.0
- Cash flow +0.0/30.0
- 1% rule +0.0/10.0
- DSCR +0.0/10.0
$764,995
🖨 Deal sheet 📄 Offer letter ✓ Due diligence
Listing remarks MLS
Corner lots six and seven are minutes away from Trinity Groves. Only 1.6 miles away from Margaret Hunt Hill bridge. This is one area of land that you don't want to miss.
Key facts
- New construction
- Covered patio
- Open-concept layout
Tags
Property features AI
Finance
- Other: Builder listing / special listing condition: Builder; Possession at closing/funding; Staging furniture excluded
- Financial info: Listing accepts Cash, Conventional, and VA loan financing; No second mortgage
- HOA & community: No association
Exterior
- Parking: Attached 2-car garage; 2 covered/carport spaces
- Utilities: City sewer; Not in a municipal utility district
- Home design: Single family residence; Two-story; Residential property
- Construction: Shingle roof; Slab foundation; New construction (built in 2026)
- Exterior features: Covered porch; Covered deck; Attached grill / outdoor grill; Private yard; High fence
Interior
- Kitchen: Dishwasher; Disposal; Gas cooktop; Microwave; Built-in cabinets; Kitchen island; Pantry and walk-in pantry; Water line to refrigerator
- Bedrooms: 5 bedrooms total; Primary bedroom on main level with walk-in closet; Additional bedrooms on second level
- Flooring: Vinyl flooring
- Bathrooms: 3 full bathrooms; 1 half bathroom; Primary bathroom on main level with separate shower
- Heating & cooling: Central air
- Interior features: Open floorplan; Chandelier; Kitchen island; Pantry; Walk-in closets; Two living areas; One dining area; Total of 13 rooms; Fireplace in living room
- Laundry & utility: Utility room; Full-size washer/dryer area
Neighborhood map
What this means for you Summary
Snapshot
- This is a 2-bed/1.0-bath single-family listed at $765k.
Deal economics
- At list price, monthly cash flow is $-4k ($-43k/yr) — negative.
- To cash-flow at today's rent, offer at most $130k (83.0% below list).
- To meet the 1% rule (rent ≥ 1% of price), the offer needs to be $160k (79.1% below list).
- Recommended offer: $130k (83.0% below list) — sets the bar for cash-flow.
- Cap rate 0.7% vs local median 2.3% in Dallas — below-typical yield; the buyer is paying a premium for something (appreciation thesis, condition, location) that the cap rate doesn't capture.
Location & tenants
- Location reads 81/100 on livability (#24 in TX, #1,380 nationally) — a professional / high-income tenant draw. Strengths: amenities A+, commute A+, housing A+; Watch: crime F.
- Dallas ISD (urban): math 31% / reading 36% proficiency, ranked #559 of 826 in TX (top 68%) — families likely to look elsewhere, expect single-tenant / working-renter base with shorter leases; 83% free/reduced lunch — lower-income household profile, screen leases tightly.
- Zoned schools: C F Carr El (math 32% / reading 22%, grade F, #2,791 of 4,322 statewide, top 68%, 281 students, 99% FRL) — zoned schools average 99% FRL vs 83% district-wide (16 pts higher); higher-poverty schools than district average — tighter screening recommended.
- Market conditions: Rents falling (-4.2%/yr); 249 active listings in the ZIP; 40 comparable units currently listed for rent nearby; rentals at typical pace (median 22d on market — plan ~3-4 weeks tenant-placement turnaround); 42% of comp listings sitting > 30 days — soft ceiling on asking rent; 12,577 units permitted in Dallas County in 2024 (6,829 in 5+ unit buildings).
- This rent runs 32% of the median local income ($60k/yr) — at the standard rent-burdened threshold; future hikes will face affordability resistance.
Forward outlook
- In year one you build about $82k of equity ($5k loan paydown + $76k appreciation (10.0% local appreciation)).
- Dallas County population projected at +35% by 2050 — long-run rental-demand tailwind backs the buy-and-hold thesis.
- By year 2, paydown + projected appreciation supports a ~$131k cash-out refi (75% LTV) — recoverable capital for the next deal without selling this one.
Negotiation context
- It's been on market 29 days — a 2% lower offer ($754k) is reasonable based on typical stale-listing flexibility.
- 3 sale attempts since 2y ago with the ask held roughly flat each time — persistent listings suggest the price (not the market) is what's stuck; bring a comps-based counter.
Risks & watch-outs
- Climate carrying-cost: major wind risk, 27% chance of damaging wind over 30y; extreme-heat days projected 7→23/yr by 2055 (HVAC capex compounding) — expect insurance premiums to compound above CPI over the hold.
Questions for the listing agent
- What do current leases actually rent for vs. the listed asking? Can we see a recent rent roll and the last 12 months of T-12 income?
- Is there a deadline driving the sale (1031 exchange, divorce, estate, relocation)? That informs how much negotiation room exists.
- Crime grade is F in this area — have there been break-ins, vandalism, or insurance claims at this property in the last 3 years? What carrier currently insures it and at what premium?
- The area grade is low — what's the realistic commute time and amenity access for the typical tenant pool here? Any planned neighborhood developments (good or bad) we should know about?
- What's the average days-on-market for RENTAL listings here right now (not sales)? A rising rental-DOM trend means longer vacancies and softer asking-rent achievability than the comps imply.
- What's the recent tenant-quality profile in this submarket — average credit score on applications, eviction rate, late-payment / NSF rate, and stable-employment percentage? A property-management company in the area should have these aggregated.
- How much new for-sale + rental construction is in the pipeline within 1–3 miles? Heavy new supply typically softens prices + rents 12–24 months out; constrained supply supports both.
Investment metrics
- 1% rule
- 0.21% ✗
- Cap rate
- 0.66%
- Cash-on-cash
- -20.13%
- DSCR
- 0.10
- GRM
- 39.8
CMA / ARV
- ARV (on-the-fly)
- $220,000
- Comps found
- 10
Show comp detail 10 sales within ~0.75 mi
| Address | Dist | Beds/Ba | Sqft | Sold | Price | $/sf | Match |
|---|---|---|---|---|---|---|---|
| 1522 Life Ave | 0.29mi | 2/1.0 | 768 (-4%) | 10mo | $240,000 | $313 | 72 |
| 1843 Nomas St | 0.34mi | 3/1.0 (+1) | 728 (-9%) | 5mo | $200,000 | $275 | 60 |
| 3623 Chicago St | 0.32mi | 2/1.0 | 744 (-7%) | 16mo | $199,900 | $269 | 60 |
| 1815 Leath St | 0.59mi | 2/2.0 | 832 (+4%) | 4mo | $195,000 | $234 | 58 |
| 3440 Rutz St | 0.19mi | 2/1.0 | 680 (-15%) | 11mo | $199,000 | $293 | 57 |
| 3513 Rutz St | 0.23mi | 2/1.0 | 720 (-10%) | 19mo | $150,000 | $208 | 57 |
| 1906 Life Ave | 0.48mi | 2/1.5 | 808 (+1%) | 24mo | $175,500 | $217 | 54 |
| 815 Shaw St | 0.50mi | 2/1.0 | 734 (-8%) | 12mo | $224,900 | $306 | 53 |
| 1407 Singleton Blvd | 0.23mi | 1/1.0 (-1) | 700 (-12%) | 18mo | $150,000 | $214 | 48 |
| 3015 Chihuahua Ave | 0.22mi | 3/2.0 (+1) | 912 (+14%) | 16mo | $265,000 | $291 | 44 |
Match score weights: distance 35% · size 25% · config 20% · recency 20%. Top-matched comps best support the ARV.
Projected returns pro-forma
10.0% appreciation · 0.0% rent growth · sell at horizon
- IRR
- 10.2%
- Equity multiple
- 1.85×
- Total profit
- $182,836
- Equity at exit
- $689,168
- IRR
- 11.2%
- Equity multiple
- 4.31×
- Total profit
- $709,521
- Equity at exit
- $1,486,217
Cash invested: $214,199 (down + closing). Projections, not guarantees.
Landlord ↔ Tenant lean methodology
- Overall (STATE)
- 87 Strongly Landlord-Friendly
- State Texas
- 87 Strongly Landlord-Friendly · R+5
- County
- — inherits STATE
- City
- — inherits STATE
ZIP-level market 75212
- Rents YoY
- -4.2%
- Active inventory
- 249
- Price-to-rent
- 39.8×
Monthly cashflow live
- Estimated rent
- $1,602 high interval (Pro) →
- Mortgage (P&I)
- −$4,012
- Tax from tax record
- −$528 /mo · $6,341/yr
- Insurance
- −$319
- HOA
- −$0
- Vacancy / Maint / Mgmt
- −$336
- Net cashflow
- $-3,593
Break-even live
UW: 25.0% down · 7.5% · 30yr · 1.5% tax · 5.0% vac · 8.0% maint · 8.0% mgmt
Financing live
Cash to close
- Down payment
- $191,249
- Closing costs
- $22,950
- Reserves months
- —
- Total cash needed
- —
Loan-product check · same deal, 3 products live
Conventional
25% down · 7.5% · 30yr
- Down + closing
- —
- Monthly P&I
- —
- Monthly cashflow
- —
- DSCR
- —
- Eligible?
- —
Personal DTI + credit; lowest rate.
DSCR
20% down · 8.5% · 30yr
- Down + closing
- —
- Monthly P&I
- —
- Monthly cashflow
- —
- DSCR
- —
- Eligible?
- —
No personal income docs; deal must DSCR.
Hard money
10% down · 12.0% · 12mo
- Down + closing
- —
- Monthly P&I
- —
- Monthly cashflow
- —
- DSCR
- —
- Eligible?
- —
Short-term bridge; refi at stabilization.
Rent comps 40 comps
| Address | Beds | Baths | Sqft | Rent | $/sqft | DOM | Units | Dist |
|---|---|---|---|---|---|---|---|---|
| 1520 McBroom St Dallas, TX | 2.0 | 1.0 | 900 | $1,590 | $1.77 | 43d | 1 | 0.05mi |
| 3113 Navaro St Unit N/A Dallas, TX | 2.0 | 2.0 | 735 | $1,800 | $2.45 | 43d | 1 | 0.20mi |
| 3113 Navaro St Dallas, TX | 2.0 | 2.0 | 735 | $1,600 | $2.18 | 24d | 1 | 0.20mi |
| 1728 McBroom St Dallas, TX | 3.0 | 1.0 | 1027 | $1,695 | $1.65 | 43d | 1 | 0.21mi |
| 3015 Chihuahua Ave Unit 1069902P Dallas, TX | 3.0 | 2.0 | 904 | $7,245 | $8.01 | 2d | 1 | 0.22mi |
| 3015 Chihuahua Ave Dallas, TX | 3.0 | 2.0 | 912 | $4,500 | $4.93 | 7d | 1 | 0.23mi |
| 1218 Singleton Blvd Dallas, TX | 1.0 | 1.0 | 756 | $1,670 | $2.21 | 43d | 1 | 0.28mi |
| 1600 Singleton Blvd Dallas, TX | 1.0 | 1.0 | 674 | $944 | $1.40 | 43d | 1 | 0.32mi |
| 2901 Borger St Apt 511 Dallas, TX | 2.0 | 2.0 | 1084 | $1,807 | $1.67 | 3d | 1 | 0.34mi |
| 2901 Borger St Apt 411 Dallas, TX | 1.0 | 1.0 | 622 | $1,281 | $2.06 | 3d | 1 | 0.34mi |
| 1010 Singleton Blvd Unit 1025 Dallas, TX | 1.0 | 1.0 | 656 | $1,677 | $2.56 | 15d | 1 | 0.38mi |
| 1010 Singleton Blvd Unit 1025 Dallas, TX | 1.0 | 1.0 | 756 | $2,089 | $2.76 | 2d | 1 | 0.38mi |
| 1010 Singleton Blvd Unit 1047 Dallas, TX | 2.0 | 2.0 | 990 | $2,284 | $2.31 | 3d | 1 | 0.38mi |
| 1010 Singleton Blvd Unit 412 Dallas, TX | 1.0 | 1.0 | 656 | $1,672 | $2.55 | 14d | 1 | 0.38mi |
| 1914 McBroom St Unit 3 Dallas, TX | 1.0 | 1.0 | 550 | $900 | $1.64 | 43d | 1 | 0.41mi |
| 3213 Obenchain St Dallas, TX | 3.0 | 1.0 | 1120 | $1,690 | $1.51 | 43d | 1 | 0.41mi |
| 996 Singleton Blvd Dallas, TX | 1.0 | 1.0 | 774 | $1,350 | $1.74 | 43d | 1 | 0.41mi |
| 996 Singleton Blvd Dallas, TX | 1.0 | 1.0 | 774 | $1,350 | $1.74 | 22d | 1 | 0.41mi |
| 990 Singleton Blvd Dallas, TX | 2.0 | 1.0–2.5 | 942 | $2,235 | $2.37 | 1d | 28 | 0.50mi |
| 1944 Gallagher St Dallas, TX | 3.0 | 2.0 | 1125 | $1,961 | $1.74 | 5d | 1 | 0.52mi |
| 941 Bayonne St Unit 941 Dallas, TX | 2.0 | 2.0 | 917 | $1,295 | $1.41 | 18d | 1 | 0.53mi |
| 941 Bayonne St Unit 939 Dallas, TX | 2.0 | 2.0 | 917 | $1,350 | $1.47 | 4d | 1 | 0.53mi |
| 1815 Leath St Dallas, TX | 2.0 | 2.0 | 832 | $2,100 | $2.52 | 2d | 1 | 0.59mi |
| 500 Singleton Blvd Dallas, TX | 1.0 | 1.0 | 648 | $851 | $1.31 | 43d | 1 | 0.63mi |
| 1902 Angelina Dr Dallas, TX | 3.0 | 1.0 | 1040 | $1,725 | $1.66 | 18d | 1 | 0.68mi |
| 716 W Commerce St Dallas, TX | 1.0 | 1.0 | 676 | $1,170 | $1.73 | 43d | 1 | 0.82mi |
| 707 Seale St Dallas, TX | 1.0 | 1.0 | 720 | $1,575 | $2.19 | 43d | 1 | 0.87mi |
| 320 Singleton Blvd Dallas, TX | 2.0 | 1.0–2.0 | 874 | $2,084 | $2.38 | 2d | 18 | 0.89mi |
| 400 W Main St Dallas, TX | 1.0 | 1.0 | 688 | $977 | $1.42 | 43d | 1 | 0.94mi |
| 455 W Commerce St Dallas, TX | 1.0 | 1.0 | 597 | $1,367 | $2.29 | 43d | 1 | 0.94mi |
| 455 W Commerce St Dallas, TX | 2.0 | 2.0 | 1121 | $1,810 | $1.61 | 19d | 1 | 0.94mi |
| 455 W Commerce St Dallas, TX | 2.0 | 2.0 | 1121 | $1,810 | $1.61 | 20d | 1 | 0.94mi |
| 455 W Commerce St Dallas, TX | 1.0 | 1.0 | 597 | $1,367 | $2.29 | 22d | 1 | 0.94mi |
| 718 Fort Worth Ave Dallas, TX | 1.0 | 1.0 | 744 | $1,391 | $1.87 | 15d | 1 | 0.95mi |
| 718 Fort Worth Ave Dallas, TX | 1.0 | 1.0 | 744 | $1,391 | $1.87 | 43d | 1 | 0.95mi |
| 710 Fort Worth Ave Dallas, TX | 2.0 | 2.0 | 1122 | $1,479 | $1.32 | 43d | 1 | 0.96mi |
| 431 W Commerce St Dallas, TX | 1.0 | 1.0 | 837 | $1,482 | $1.77 | 22d | 1 | 0.97mi |
| 431 W Commerce St Dallas, TX | 1.0 | 1.0 | 837 | $1,482 | $1.77 | 43d | 1 | 0.97mi |
| 431 W Commerce St Dallas, TX | 2.0 | 1.0 | 1037 | $2,568 | $2.48 | 24d | 1 | 0.97mi |
| 604 Fort Worth Ave Dallas, TX | 1.0 | 1.0 | 725 | $1,300 | $1.79 | 43d | 1 | 0.97mi |
Listing history 25 events
-
2026-06-18days on market $764,995 Active 29 DOM
-
2026-06-17days on market $764,995 Active 28 DOM
-
2026-06-16days on market $764,995 Active 27 DOM
-
2026-06-15days on market $764,995 Active 26 DOM
-
2026-06-13pricedays on market $764,995 Active 24 DOM
-
2026-06-09days on market $789,995 Active 20 DOM
-
2026-06-08days on market $789,995 Active 19 DOM
-
2026-06-07days on market $789,995 Active 18 DOM
-
2026-06-04days on market $789,995 Active 15 DOM
-
2026-06-03days on market $789,995 Active 14 DOM
-
2026-06-02days on market $789,995 Active 13 DOM
-
2026-06-01days on market $789,995 Active 12 DOM
-
2026-05-31days on market $789,995 Active 11 DOM
-
2026-05-20$789,995 Active
-
2025-05-12soldstatus
-
2025-05-07soldstatus Closed 169-char remark
Show marketing remark (169 chars)
Corner lots six and seven are minutes away from Trinity Groves. Only 1.6 miles away from Margaret Hunt Hill bridge. This is one area of land that you don't want to miss.
-
2025-04-06status Pending 169-char remark
Show marketing remark (169 chars)
Corner lots six and seven are minutes away from Trinity Groves. Only 1.6 miles away from Margaret Hunt Hill bridge. This is one area of land that you don't want to miss.
-
2025-03-30historical Active Option Contract 169-char remark
Show marketing remark (169 chars)
Corner lots six and seven are minutes away from Trinity Groves. Only 1.6 miles away from Margaret Hunt Hill bridge. This is one area of land that you don't want to miss.
-
2025-03-28status Active 169-char remark
Show marketing remark (169 chars)
Corner lots six and seven are minutes away from Trinity Groves. Only 1.6 miles away from Margaret Hunt Hill bridge. This is one area of land that you don't want to miss.
-
2025-03-13historical 169-char remark
Show marketing remark (169 chars)
Corner lots six and seven are minutes away from Trinity Groves. Only 1.6 miles away from Margaret Hunt Hill bridge. This is one area of land that you don't want to miss.
-
2025-01-29price $350,000 169-char remark
Show marketing remark (169 chars)
Corner lots six and seven are minutes away from Trinity Groves. Only 1.6 miles away from Margaret Hunt Hill bridge. This is one area of land that you don't want to miss.
-
2024-07-08price $380,000 169-char remark
Show marketing remark (169 chars)
Corner lots six and seven are minutes away from Trinity Groves. Only 1.6 miles away from Margaret Hunt Hill bridge. This is one area of land that you don't want to miss.
-
2024-04-18price $400,000 169-char remark
Show marketing remark (169 chars)
Corner lots six and seven are minutes away from Trinity Groves. Only 1.6 miles away from Margaret Hunt Hill bridge. This is one area of land that you don't want to miss.
-
2024-03-13$420,000 Active 169-char remark
Show marketing remark (169 chars)
Corner lots six and seven are minutes away from Trinity Groves. Only 1.6 miles away from Margaret Hunt Hill bridge. This is one area of land that you don't want to miss.
-
2017-09-01soldstatus
ⓘ Source: listings_history table (triggers on properties + properties_extension) + one-shot
backfill from property_details.listing_events for pre-trigger history.
Tax reassessment forecast TX · Resets to sale price
- Current annual tax
- $6,341 · $528/mo
- Projected year-2 tax
- $13,999 · $1,167/mo
- Expected delta
- +$7,659/yr (+$638/mo · 120.8%)
ⓘ Screening estimate from a state-policy table — verify with the county assessor before closing.
Climate risk First Street
- Flood 1/10 Low FEMA zone X · 0% chance over 30 yrs
- Wildfire 1/10 Low
- Heat 7/10 Severe 7 d/yr ≥109°F today · 23 d/yr by 30 yrs out
- Wind 6/10 Major 27% chance of damaging wind over 30 yrs
- Air quality 3/10 Moderate 2 unhealthy d/yr today · 3 by 30 yrs out
Nearby sold comps map
Loading sold comps map…
Walkable amenities ~0.75 mi
Loading nearby amenities…
Taxation est. · year 1
- Rental income
- $19,222
- − Mortgage interest
- −$42,852
- − Property taxes
- −$6,341
- − Insurance
- −$3,825
- − Repairs & maintenance
- −$1,538
- − Management
- −$1,538
- − Depreciation
- −$22,254
- Taxable loss
- −$59,126
- Est. tax savings @ 24.0%
- +$14,190
- After-tax cash flow
- $-28,931/yr
For passive investors: Depreciation is non-cash, so a rental often shows a tax loss while cash-flowing — sheltering income. Rental losses are passive: they offset passive income freely, and up to $25,000/yr can offset ordinary (W-2) income if you actively participate and your MAGI is under $100k (phasing out to $0 by $150k); unused losses carry forward. On sale, claimed depreciation is recaptured at up to 25%, and gains may owe capital-gains tax (a 1031 exchange can defer both). Figures are a year-1 estimate at your 24.0% rate — not tax advice; consult a CPA.
Schools (NCES district)
- District
- Dallas ISD
- NCES district ID
- 4816230
- Math proficiency
- 31% ▼ -16.00%
- Reading proficiency
- 36% ▼ -4.00%
- Median HH income
- $42,881
- Composite
- 28.41/100
- National rank
- #6763
- State rank
- #559 of 826 in TX
Livability — Dallas
- Score
- 81/100
- State rank
- #24
- US rank
- #1380
Category grades
Schools grade is shown separately in the Schools card above.
Census & demographics
- Census place
- Dallas, TX
- County
- Dallas County · 2,612,404 people
- City population
- 1,168,437
- Metro
- Dallas-Fort Worth-Arlington, TX
- Population (ZIP)
- 28,259
- Household income
- $59,750
- Rent vs Own
- Severe rent burden
- 892.0
Population outlook (Dallas County) Hauer SSP2
- Today (2025)
- 2,979,839 people
- By 2030
- 3,191,823 · +7.1%
- By 2040
- 3,619,611 · +21.5%
- By 2050
- 4,026,915 · +35.1%
- By 2075
- 4,957,073 · +66.4%
- By 2100
- 5,508,725 · +84.9%
Race, ethnicity, and origin ACS 2023
- Neighborhood character
- Predominantly Hispanic (67%)
- Race & ethnicity
- Hispanic / Latino 67% Two or more races 26% Black 23% White 6% Asian 2%
- Hispanic origin (detail)
- Mexican 55%
- Common ancestry
- Slovak 1%
- Foreign-born
- 27% · Canada, Vietnam, Jamaica
- Languages at home
- 42% English-only · Spanish 52% Vietnamese 1%
Political lean MEDSL · Dallas
- 2024 margin
- Strong D (+22.2) · D 60.2% · R 38.0% · Other 1.8%
- 2008→2024 swing
- +6.9pp toward D · 2008: 15.3pp · 2024: 22.2pp
- All cycles
- 2024: D+22.2 2020: D+31.6 2016: D+26.2 2012: D+15.4 2008: D+15.3
Not yet ingested
- Civics
- —
Market trends
- HPI YoY
- ▲ 138.69%
- Current HPI
- 477.2035
- Rent YoY
- ▼ -4.21%
- Metro
- Dallas-Fort Worth-Arlington, TX
- State GDP YoY
- ▲ 3.95%
- F500 in state
- 110
Industry mix (Fortune 500 HQ in TX)
| Industry | F500 HQs | Revenue |
|---|---|---|
| Energy | 16 | $1,198B |
|
||
| Technology | 5 | $198B |
|
||
| Engineering / Construction | 4 | $72B |
|
||
| Energy Services | 3 | $60B |
|
||
| Utilities | 3 | $41B |
|
||
| Healthcare | 2 | $330B |
|
||
Price history
+88.1% since first listed12 events — show timeline
- 2026-05-20 Listed $789,995 NTREIS
- 2025-05-12 Sold (Public Records) — Public Records
- 2025-05-07 Sold (MLS) — NTREIS
- 2025-04-06 Pending — NTREIS
- 2025-03-30 Contingent — NTREIS
- 2025-03-28 Relisted — NTREIS
- 2025-03-13 Listing Removed — NTREIS
- 2025-01-29 Price Changed $350,000 NTREIS
- 2024-07-08 Price Changed $380,000 NTREIS
- 2024-04-18 Price Changed $400,000 NTREIS
- 2024-03-13 Listed $420,000 NTREIS
- 2017-09-01 Sold (Public Records) — Public Records
Property tax history
+16.4%/yrLatest (2025): $6,341 · -14.6% YoY. Source: county tax records.
Cash-flow waterfall
monthlySold comps — $/sqft
last 12 mo · ≤1 miLoading sold comps…