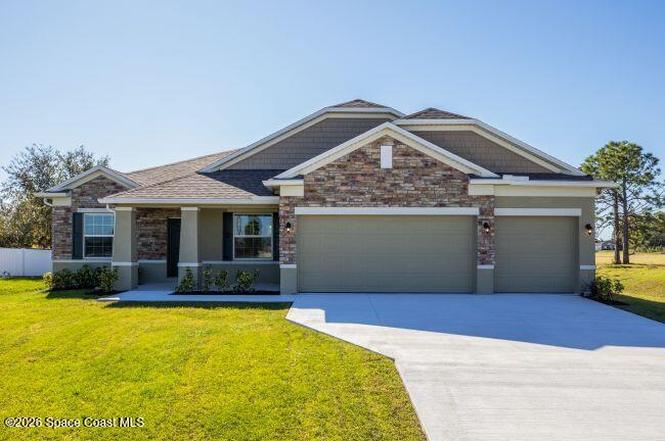
8746 103rd Ave
Vero Lake Estates, FL 32967
$392,900F
4 bd · 3.0 ba ·
2,435 sqft ·
Built 2026
· Land
· Pending
· 15 DOM
Cashflow @ list (25.0% down · 7.5%)
Estimated rent
$2,521/mo
Mortgage (P&I)
−$2,060
Tax + insurance
−$1,081
HOA
−$0
Vac / Maint / Mgmt
−$529
Net cashflow
$-1,150/mo
Annual
$-13,798/yr
Cap rate
4.08%
Cash-on-cash
-7.89%
DSCR
0.65
1% rule
0.64%
Cash to close
$110,012
Investor read
- This is a 4-bed/3.0-bath land listed at $393k.
- At list price, monthly cash flow is $-1k ($-14k/yr) — negative.
- To cash-flow at today's rent, offer at most $227k (42.3% below list).
- To meet the 1% rule (rent ≥ 1% of price), the offer needs to be $252k (35.8% below list).
- It's been on market 15 days — a 2% lower offer ($387k) is reasonable based on typical stale-listing flexibility.
- Recommended offer: $227k (42.3% below list) — sets the bar for cash-flow.
- Local home prices are declining (-3.0%/yr); year-one equity from $3k of loan paydown is wiped out by about $12k of value loss. Plan a longer hold.
- Location reads: area grade F — affects rentability + tenant quality, not the cash-flow math above.
- Indian River (other): math 48% / reading 52% proficiency, ranked #35 of 73 in FL (top 48%) — acceptable for families but not a draw, mixed tenant base, ~2y average lease.
- Zoned schools: Treasure Coast Elementary School (math 61% / reading 57%, grade B-, #722 of 2,144 statewide, top 34%, 691 students, 59% FRL); Sebastian River Middle School (math 46% / reading 44%, grade D, #310 of 571 statewide, top 56%, 862 students, 65% FRL); Sebastian River High School (math 29% / reading 45%, grade F, #340 of 667 statewide, top 52%, 1,843 students, 52% FRL).
- Watch-outs: flood insurance adds $427/mo.
- Market conditions: Rents soft (-1.2%/yr); 611 active listings in the ZIP; 5 comparable units currently listed for rent nearby; rentals at typical pace (median 23d on market — plan ~3-4 weeks tenant-placement turnaround); solid renter incomes; 564 units permitted in Indian River County in 2024 (281 in 5+ unit buildings).
- Indian River County population projected at +18% by 2050 — long-run rental-demand tailwind backs the buy-and-hold thesis.
- 2 sale attempts with the ask held roughly flat each time — persistent listings suggest the price (not the market) is what's stuck; bring a comps-based counter.
- Current owner paid $159k; list at $393k implies a 147% gain — meaningful room to come down on a strong offer.
- Climate carrying-cost: in FEMA flood zone AE (mandatory federal flood insurance); severe wind risk, 99% chance of damaging wind over 30y; extreme-heat days projected 7→23/yr by 2055 (HVAC capex compounding) — expect insurance premiums to compound above CPI over the hold.
- This rent runs 39% of the median local income ($78k/yr) — at the standard rent-burdened threshold; future hikes will face affordability resistance.
Questions for listing agent
- What do current leases actually rent for vs. the listed asking? Can we see a recent rent roll and the last 12 months of T-12 income?
- What's the actual annual flood-insurance premium (NFIP or private), and is the property in a SFHA with mandatory coverage?
- Is there a deadline driving the sale (1031 exchange, divorce, estate, relocation)? That informs how much negotiation room exists.
- The area grade is low — what's the realistic commute time and amenity access for the typical tenant pool here? Any planned neighborhood developments (good or bad) we should know about?
- What's the average days-on-market for RENTAL listings here right now (not sales)? A rising rental-DOM trend means longer vacancies and softer asking-rent achievability than the comps imply.
- What's the recent tenant-quality profile in this submarket — average credit score on applications, eviction rate, late-payment / NSF rate, and stable-employment percentage? A property-management company in the area should have these aggregated.
- How much new for-sale + rental construction is in the pipeline within 1–3 miles? Heavy new supply typically softens prices + rents 12–24 months out; constrained supply supports both.
CashFlowRE · CFR-EY6C144K5DWFD5
· Data 1 week ago
cashflowre.app · 2026-05-29