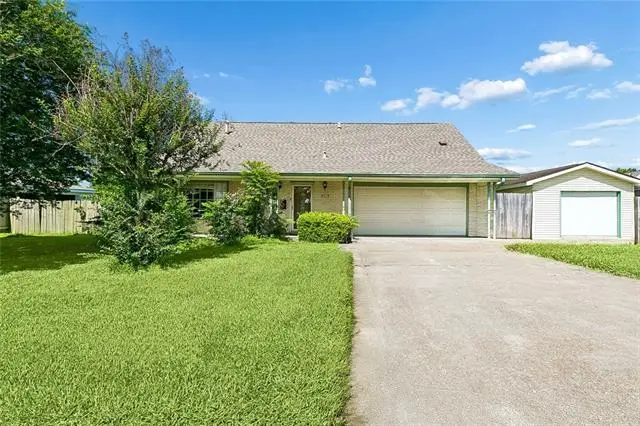
3113 Huntsville St
Kenner, LA 70065
$285,000D-
4 bd · 2.0 ba ·
2,350 sqft ·
Built 1966
· SingleFamily
· Active
· 19 DOM
Cashflow @ list (25.0% down · 7.5%)
Estimated rent
$2,362/mo
Mortgage (P&I)
−$1,495
Tax + insurance
−$294
HOA
−$0
Vac / Maint / Mgmt
−$496
Net cashflow
$77/mo
Annual
$928/yr
Cap rate
6.62%
Cash-on-cash
1.16%
DSCR
1.05
1% rule
0.83%
Cash to close
$79,800
Investor read
- This is a 4-bed/2.0-bath single-family listed at $285k.
- At list price, monthly cash flow is $77 ($928/yr) — positive.
- The deal already cash-flows at list — no discount required.
- To meet the 1% rule (rent ≥ 1% of price), the offer needs to be $236k (17.1% below list).
- It's been on market 19 days — a 2% lower offer ($281k) is reasonable based on typical stale-listing flexibility.
- Recommended offer: $236k (17.1% below list) — sets the bar for 1% rule.
- Local home prices are declining (-3.0%/yr); year-one equity from $2k of loan paydown is wiped out by about $9k of value loss. Plan a longer hold.
- Location reads 78/100 on livability (#6 in LA, #2,414 nationally) — a middle-class / working-renter tenant base. Strengths: cost of living A+, housing A+, health & safety A+; Watch: amenities C-, employment C-, crime D.
- Jefferson Parish (suburban): math 24% / reading 34% proficiency, ranked #44 of 98 in LA (top 45%) — low school quality limits family demand, transient renter base, plan for 1-2y turnover; 70% free/reduced lunch — lower-income household profile, screen leases tightly.
- Market conditions: Rents falling (-4.2%/yr); 292 active listings in the ZIP; 9 comparable units currently listed for rent nearby; rentals at typical pace (median 24d on market — plan ~3-4 weeks tenant-placement turnaround); 44% of comp listings sitting > 30 days — soft ceiling on asking rent; 518 units permitted in Jefferson Parish in 2024 (43 in 5+ unit buildings).
- 4 sale attempts since 7y ago with the ask held roughly flat each time — persistent listings suggest the price (not the market) is what's stuck; bring a comps-based counter.
- Current owner paid $208k; 37% above their basis — modest negotiation headroom, anchor on the comps not their cost.
- Cap rate 6.6% vs local median 5.3% in Kenner — meaningfully above typical; check what's discounted (condition, days-on-market, listing class) to confirm the premium yield is real.
- This rent runs 42% of the median local income ($67k/yr) — at the standard rent-burdened threshold; future hikes will face affordability resistance.
Questions for listing agent
- Built in 1966 — when were the roof, HVAC, electrical panel, plumbing, and water heater last replaced?
- Is there a deadline driving the sale (1031 exchange, divorce, estate, relocation)? That informs how much negotiation room exists.
- Crime grade is D in this area — have there been break-ins, vandalism, or insurance claims at this property in the last 3 years? What carrier currently insures it and at what premium?
- The area grade is low — what's the realistic commute time and amenity access for the typical tenant pool here? Any planned neighborhood developments (good or bad) we should know about?
- What's the average days-on-market for RENTAL listings here right now (not sales)? A rising rental-DOM trend means longer vacancies and softer asking-rent achievability than the comps imply.
- What's the recent tenant-quality profile in this submarket — average credit score on applications, eviction rate, late-payment / NSF rate, and stable-employment percentage? A property-management company in the area should have these aggregated.
- How much new for-sale + rental construction is in the pipeline within 1–3 miles? Heavy new supply typically softens prices + rents 12–24 months out; constrained supply supports both.
CashFlowRE · CFR-EYEDVE2S19WK7F
· Data 2 days ago
cashflowre.app · 2026-05-29