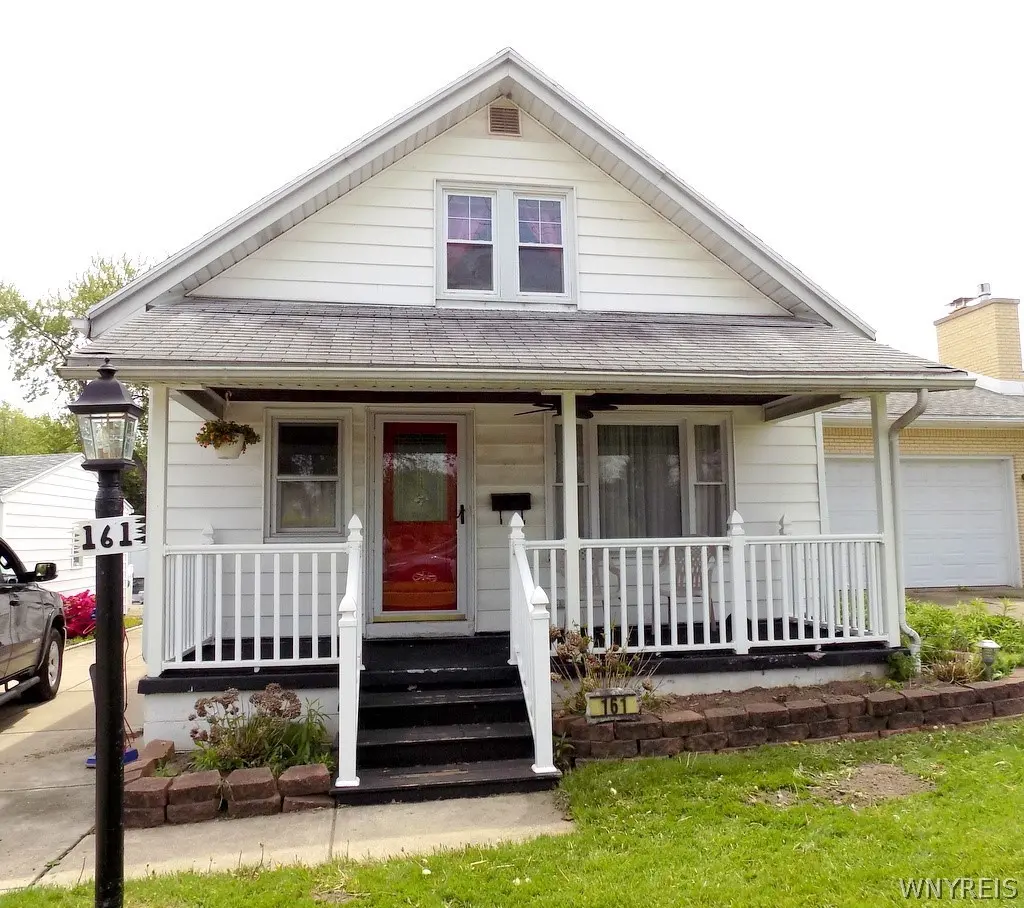
161 Brighton Rd
Tonawanda Town, NY 14150
$185,000D+
3 bd · 1.0 ba ·
1,014 sqft ·
Built 1945
· SingleFamily
· Pending
· 12 DOM
Cashflow @ list (25.0% down · 7.5%)
Estimated rent
$1,830/mo
Mortgage (P&I)
−$970
Tax + insurance
−$598
HOA
−$0
Vac / Maint / Mgmt
−$384
Net cashflow
$-122/mo
Annual
$-1,470/yr
Cap rate
5.50%
Cash-on-cash
-2.84%
DSCR
0.87
1% rule
0.99%
Cash to close
$51,800
Investor read
- This is a 3-bed/1.0-bath single-family listed at $185k.
- At list price, monthly cash flow is $-122 ($-1k/yr) — negative.
- To cash-flow at today's rent, offer at most $163k (11.7% below list).
- To meet the 1% rule (rent ≥ 1% of price), the offer needs to be $183k (1.1% below list).
- Only 12 days on market — expect competitive offers; lowballing is unlikely to land.
- Recommended offer: $163k (11.7% below list) — sets the bar for cash-flow.
- Local home prices are declining (-3.0%/yr); year-one equity from $1k of loan paydown is wiped out by about $6k of value loss. Plan a longer hold.
- Location reads: area grade D — affects rentability + tenant quality, not the cash-flow math above.
- Kenmore-Tonawanda Union Free School District (suburban): math 44% / reading 47% proficiency, ranked #453 of 590 in NY (top 77%) — families likely to look elsewhere, expect single-tenant / working-renter base with shorter leases.
- Zoned schools: Thomas A Edison Elementary School (math 47% / reading 62%, grade C, #908 of 2,108 statewide, top 46%, 615 students, 40% FRL); Herbert Hoover Middle School (math 24% / reading 39%, grade F, #522 of 729 statewide, top 73%, 758 students, 51% FRL); Kenmore West Senior High School (math 74% / reading 57%, grade B, #773 of 1,100 statewide, top 70%, 1,358 students, 51% FRL).
- Watch-outs: property tax is 3.4% of price; built in 1945 — expect roof / HVAC / electrical / plumbing capex.
- Market conditions: Rents rising fast (+6.8%/yr); 195 active listings in the ZIP; 9 comparable units currently listed for rent nearby; rentals at typical pace (median 20d on market — plan ~3-4 weeks tenant-placement turnaround); 1,244 units permitted in Erie County in 2024 (563 in 5+ unit buildings).
- 2 sale attempts with the ask held roughly flat each time — persistent listings suggest the price (not the market) is what's stuck; bring a comps-based counter.
- Cap rate 5.5% vs local median 4.0% in Tonawanda Town — top-decile yield for the area; either an underpriced asset or a hidden risk that comps aren't pricing in. Stress-test before assuming the spread holds.
- This rent runs 31% of the median local income ($71k/yr) — at the standard rent-burdened threshold; future hikes will face affordability resistance.
Questions for listing agent
- What do current leases actually rent for vs. the listed asking? Can we see a recent rent roll and the last 12 months of T-12 income?
- Built in 1945 — when were the roof, HVAC, electrical panel, plumbing, and water heater last replaced?
- Property tax is high relative to price — has the assessment been appealed recently, and will the sale trigger a re-assessment?
- Is there a deadline driving the sale (1031 exchange, divorce, estate, relocation)? That informs how much negotiation room exists.
- The area grade is low — what's the realistic commute time and amenity access for the typical tenant pool here? Any planned neighborhood developments (good or bad) we should know about?
- What's the average days-on-market for RENTAL listings here right now (not sales)? A rising rental-DOM trend means longer vacancies and softer asking-rent achievability than the comps imply.
- What's the recent tenant-quality profile in this submarket — average credit score on applications, eviction rate, late-payment / NSF rate, and stable-employment percentage? A property-management company in the area should have these aggregated.
- How much new for-sale + rental construction is in the pipeline within 1–3 miles? Heavy new supply typically softens prices + rents 12–24 months out; constrained supply supports both.
CashFlowRE · CFR-EZ04T14AKH06HK
· Data 1 week ago
cashflowre.app · 2026-05-29