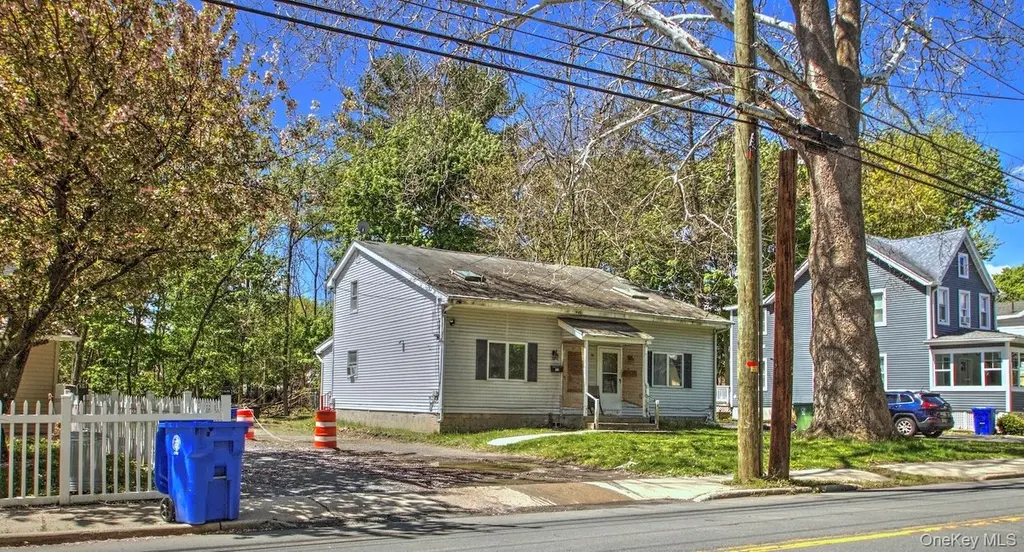
32 Genung St
Middletown, NY 10940
$359,999C+
2 bd · 2.5 ba ·
2,249 sqft ·
Built 1985
· MultiFamily
· Active
· 25 DOM
Cashflow @ list (25.0% down · 7.5%)
Estimated rent
$4,151/mo
Mortgage (P&I)
−$1,888
Tax + insurance
−$1,541
HOA
−$0
Vac / Maint / Mgmt
−$872
Net cashflow
$-150/mo
Annual
$-1,797/yr
Cap rate
7.33%
Cash-on-cash
3.70%
DSCR
1.16
1% rule
1.15%
Cash to close
$100,800
Investor read
- This is a 2-bed/2.5-bath multifamily listed at $360k.
- At list price, monthly cash flow is $-150 ($-2k/yr) — negative.
- To cash-flow at today's rent, offer at most $334k (7.3% below list).
- Meets the 1% rule at list price ($4k rent vs $360k).
- It's been on market 25 days — a 2% lower offer ($355k) is reasonable based on typical stale-listing flexibility.
- Recommended offer: $334k (7.3% below list) — sets the bar for cash-flow.
- Local home prices are declining (-3.0%/yr); year-one equity from $2k of loan paydown is wiped out by about $11k of value loss. Plan a longer hold.
- Location reads 82/100 on livability (#79 in NY, #1,219 nationally) — a professional / high-income tenant draw. Strengths: amenities A+, housing A+, health & safety A+; Watch: commute C-, schools D+.
- Middletown City School District (suburban): math 41% / reading 55% proficiency, ranked #411 of 590 in NY (top 70%) — families likely to look elsewhere, expect single-tenant / working-renter base with shorter leases; 61% free/reduced lunch — lower-income household profile, screen leases tightly.
- Watch-outs: property tax is 3.1% of price; flood insurance adds $460/mo.
- Market conditions: Rents rising fast (+8.2%/yr); 273 active listings in the ZIP; 11 comparable units currently listed for rent nearby; rentals lingering (median 44d on market — plan ~5-8 weeks vacancy on turnover, expect pricing pressure); 64% of comp listings sitting > 30 days — soft ceiling on asking rent; solid renter incomes; 1,746 units permitted in Orange County in 2024 (1,265 in 5+ unit buildings).
- Climate carrying-cost: in FEMA flood zone AE (mandatory federal flood insurance) — expect insurance premiums to compound above CPI over the hold.
- Cap rate 7.3% vs local median 3.3% in Middletown — top-decile yield for the area; either an underpriced asset or a hidden risk that comps aren't pricing in. Stress-test before assuming the spread holds.
- At $4,151/mo this rent would consume 57% of the median local household income ($87k/yr) (locally 1846% of renters already pay >50% of income on rent) — very limited rent-growth headroom before tenants either downsize or default.
Questions for listing agent
- What do current leases actually rent for vs. the listed asking? Can we see a recent rent roll and the last 12 months of T-12 income?
- Property tax is high relative to price — has the assessment been appealed recently, and will the sale trigger a re-assessment?
- What's the actual annual flood-insurance premium (NFIP or private), and is the property in a SFHA with mandatory coverage?
- Is there a deadline driving the sale (1031 exchange, divorce, estate, relocation)? That informs how much negotiation room exists.
- Schools are D-rated, which usually means shorter tenancies and higher turnover. Who's the typical renter profile here, and what's been the actual vacancy rate?
- What's the average days-on-market for RENTAL listings here right now (not sales)? A rising rental-DOM trend means longer vacancies and softer asking-rent achievability than the comps imply.
- What's the recent tenant-quality profile in this submarket — average credit score on applications, eviction rate, late-payment / NSF rate, and stable-employment percentage? A property-management company in the area should have these aggregated.
- How much new apartment / multifamily construction is in the pipeline within 1–3 miles? Heavy new supply (>2% of stock underway) typically softens rents 12–24 months out; light construction supports rent growth.
CashFlowRE · CFR-F09VSPEZ4RJ2MF
· Data 3 weeks ago
cashflowre.app · 2026-05-29