 🏷️ Likely Rental
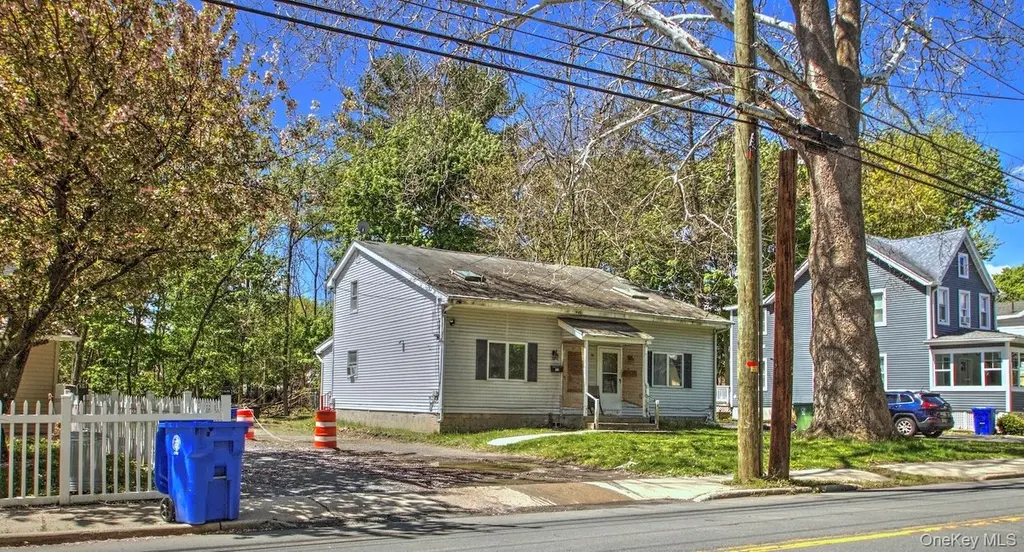
32 Genung St · Middletown, NY
Flood risk 6/10 · Moderate
- FEMA flood zone
- AE
- Chance of flooding over 30 yrs
- 0.73%
- Est. flood insurance / yr
- $2,026 – $9,024
Fire risk 2/10 · Minimal
- Est. fire insurance / yr
- $691 – $1,283
Heat risk 4/10 · Minor
- Hot days now (above 99°F)
- 7 days/yr
- Hot days in 30 yrs
- 15 days/yr
Wind risk 4/10 · Minor
- Chance of severe wind over 30 yrs
- 10.0%
Air-quality risk 2/10 · Minimal
- Unhealthy air days now
- 1 days/yr
- Unhealthy air days in 30 yrs
- 2 days/yr
Risk factors via First Street. Map © Google.
Why this score? — see what drove the C+ grade
The composite is a weighted blend of 9 inputs, each scored 0–100. Each bar is that input's sub-score; the figure is the points it added to the 100-point composite (weight × sub-score).
- Cash flow +18.0/30.0
- ARV discount +15.0/15.0
- 1% rule +6.5/10.0
- DSCR +5.6/10.0
- Rent growth +4.6/5.0
- Schools +4.2/10.0
- Livability +4.1/5.0
- Condition / age +2.5/5.0
- Appreciation +0.0/10.0
$359,999
🖨 Deal sheet 📄 Offer letter ✓ Due diligence
Multi-family units
County records classify this as Multi-Family (2-4 Unit). Listing-text estimate: 1 unit. estimate disagrees with records
Listing remarks
Calling all investors. Opportunity to own a two-unit income property in a great location. The 1-bedroom unit is rented * * currently rented below market * * It has an updated kitchen. I will have some pictures of that unit shortly. The 2-bedroom unit is vacant but currently also listed for rent. It does need some updating but has great potential. The primary bedroom on the first floor is very large and has direct access to the backyard and the half bath on the first floor has hook up for a washer/ dryer. Both units have cathedral ceilings and lots of natural light. With some TLC this is a great investment. The property behind 32 Genung St is 28 Genung St. This is a vacant, buildable lo
Key facts
- Cathedral ceilings
- Natural light
- Updated kitchen
Tags
Property features AI
Exterior
- Parking: Driveway (no carport)
- Utilities: Public sewer; Electricity connected; Natural gas connected; Sewer connected
- Home design: Duplex; Actual condition
- Construction: Vinyl siding construction
- Exterior features: Vinyl siding; Not waterfront
Interior
- Bedrooms: One 1-bedroom unit; One 2-bedroom unit
- Bathrooms: Three full bathrooms
- Heating & cooling: Central air conditioning; Natural gas heating
- Interior features: First-floor bedroom; Cathedral ceilings
Neighborhood map
What this means for you Summary
Snapshot
- This is a 2-bed/2.5-bath multifamily listed at $360k.
Deal economics
- At list price, monthly cash flow is $-150 ($-2k/yr) — negative.
- To cash-flow at today's rent, offer at most $334k (7.3% below list).
- Meets the 1% rule at list price ($4k rent vs $360k).
- Recommended offer: $334k (7.3% below list) — sets the bar for cash-flow.
- Cap rate 7.3% vs local median 3.3% in Middletown — top-decile yield for the area; either an underpriced asset or a hidden risk that comps aren't pricing in. Stress-test before assuming the spread holds.
Location & tenants
- Location reads 82/100 on livability (#79 in NY, #1,219 nationally) — a professional / high-income tenant draw. Strengths: amenities A+, housing A+, health & safety A+; Watch: commute C-, schools D+.
- Middletown City School District (suburban): math 41% / reading 55% proficiency, ranked #411 of 590 in NY (top 70%) — families likely to look elsewhere, expect single-tenant / working-renter base with shorter leases; 61% free/reduced lunch — lower-income household profile, screen leases tightly.
- Market conditions: Rents rising fast (+8.2%/yr); 273 active listings in the ZIP; 11 comparable units currently listed for rent nearby; rentals lingering (median 44d on market — plan ~5-8 weeks vacancy on turnover, expect pricing pressure); 64% of comp listings sitting > 30 days — soft ceiling on asking rent; solid renter incomes; 1,746 units permitted in Orange County in 2024 (1,265 in 5+ unit buildings).
- At $4,151/mo this rent would consume 57% of the median local household income ($87k/yr) (locally 1846% of renters already pay >50% of income on rent) — very limited rent-growth headroom before tenants either downsize or default.
Forward outlook
- Local home prices are declining (-3.0%/yr); year-one equity from $2k of loan paydown is wiped out by about $11k of value loss. Plan a longer hold.
Negotiation context
- It's been on market 25 days — a 2% lower offer ($355k) is reasonable based on typical stale-listing flexibility.
Risks & watch-outs
- Watch-outs: property tax is 3.1% of price; flood insurance adds $460/mo.
- Climate carrying-cost: in FEMA flood zone AE (mandatory federal flood insurance) — expect insurance premiums to compound above CPI over the hold.
Questions for the listing agent
- What do current leases actually rent for vs. the listed asking? Can we see a recent rent roll and the last 12 months of T-12 income?
- Property tax is high relative to price — has the assessment been appealed recently, and will the sale trigger a re-assessment?
- What's the actual annual flood-insurance premium (NFIP or private), and is the property in a SFHA with mandatory coverage?
- Is there a deadline driving the sale (1031 exchange, divorce, estate, relocation)? That informs how much negotiation room exists.
- Schools are D-rated, which usually means shorter tenancies and higher turnover. Who's the typical renter profile here, and what's been the actual vacancy rate?
- What's the average days-on-market for RENTAL listings here right now (not sales)? A rising rental-DOM trend means longer vacancies and softer asking-rent achievability than the comps imply.
- What's the recent tenant-quality profile in this submarket — average credit score on applications, eviction rate, late-payment / NSF rate, and stable-employment percentage? A property-management company in the area should have these aggregated.
- How much new apartment / multifamily construction is in the pipeline within 1–3 miles? Heavy new supply (>2% of stock underway) typically softens rents 12–24 months out; light construction supports rent growth.
Investment metrics
- 1% rule
- 1.15% ✓
- Cap rate
- 7.33%
- Cash-on-cash
- 3.70%
- DSCR
- 1.16
- GRM
- 7.2
CMA / ARV
- ARV (median comp)
- $661,729
- List price
- $359,999
- Delta
- -45.60%
- Verdict
- UNDERPRICED
- Comps
- 20 within 1.0 mi
Show comp detail 3 sales within ~0.75 mi
| Address | Dist | Beds/Ba | Sqft | Sold | Price | $/sf | Match |
|---|---|---|---|---|---|---|---|
| 97 E Main St | 0.56mi | 2/— | 2,269 (+1%) | 9mo | $180,000 | $79 | 65 |
| 112 E Main St #110 | 0.57mi | 2/2.5 | 2,208 (-2%) | 17mo | $605,000 | $274 | 56 |
| 35 East Ave | 0.36mi | 3/2.0 (+1) | 1,939 (-14%) | 2mo | $440,000 | $227 | 51 |
Match score weights: distance 35% · size 25% · config 20% · recency 20%. Top-matched comps best support the ARV.
Projected returns pro-forma
-3.0% appreciation · 8.0% rent growth · sell at horizon
- IRR
- -11.6%
- Equity multiple
- 0.55×
- Total profit
- $-45,295
- Equity at exit
- $53,677
- IRR
- 5.3%
- Equity multiple
- 1.50×
- Total profit
- $50,726
- Equity at exit
- $31,126
Cash invested: $100,800 (down + closing). Projections, not guarantees.
Landlord ↔ Tenant lean methodology
- Overall (STATE)
- 15 Strongly Tenant-Friendly
- State New York
- 15 Strongly Tenant-Friendly · D+10
- County
- — inherits STATE
- City
- — inherits STATE
ZIP-level market 10940
- Home prices YoY
- -18.7%
- Rents YoY
- 8.2%
- Active inventory
- 273
- Price-to-rent
- 15.2×
Monthly cashflow live
- Estimated rent
- $4,151 high interval (Pro) →
- Mortgage (P&I)
- −$1,888
- Tax from tax record
- −$931 /mo · $11,169/yr
- Insurance
- −$150
- Flood insurance flood zone
- −$460 /mo · $5,525/yr
- HOA
- −$0
- Vacancy / Maint / Mgmt
- −$872
- Net cashflow
- $-150
Break-even live
2-unit breakdown (identical units grouped — click to expand)
| Units | Beds | Baths | Est. rent |
|---|---|---|---|
| 1× unit | 1 | 1.5 | $1,979 |
| 1× unit | 2 | 1.5 | $2,172 |
| Total (2 units) | $4,151 | ||
UW: 25.0% down · 7.5% · 30yr · 1.5% tax · 5.0% vac · 8.0% maint · 8.0% mgmt
Financing live
Cash to close
- Down payment
- $90,000
- Closing costs
- $10,800
- Reserves months
- —
- Total cash needed
- —
Loan-product check · same deal, 3 products live
Conventional
25% down · 7.5% · 30yr
- Down + closing
- —
- Monthly P&I
- —
- Monthly cashflow
- —
- DSCR
- —
- Eligible?
- —
Personal DTI + credit; lowest rate.
DSCR
20% down · 8.5% · 30yr
- Down + closing
- —
- Monthly P&I
- —
- Monthly cashflow
- —
- DSCR
- —
- Eligible?
- —
No personal income docs; deal must DSCR.
Hard money
10% down · 12.0% · 12mo
- Down + closing
- —
- Monthly P&I
- —
- Monthly cashflow
- —
- DSCR
- —
- Eligible?
- —
Short-term bridge; refi at stabilization.
Rent comps 11 comps
| Address | Beds | Baths | Sqft | Rent | $/sqft | DOM | Units | Dist |
|---|---|---|---|---|---|---|---|---|
| 26 Washington St Unit 2 Middletown, NY | 3.0 | 1.0 | 2274 | $2,100 | $0.92 | 43d | 1 | 0.27mi |
| 90 Washington St Unit 92 Middletown, NY | 2.0 | 1.0 | 1600 | $2,500 | $1.56 | 23d | 1 | 0.31mi |
| 105 Woodlake Dr Middletown, NY | 2.0 | 2.5 | 2161 | $3,000 | $1.39 | 43d | 1 | 0.50mi |
| 8 Roberts St Unit 2-A Middletown, NY | 2.0 | 1.0 | 2132 | $2,000 | $0.94 | 23d | 1 | 0.52mi |
| 30 Knapp Ave Middletown, NY | 2.0 | 1.0 | 1532 | $1,800 | $1.17 | 43d | 1 | 0.86mi |
| 169 Excelsior Ave Middletown, NY | 3.0 | 1.5 | 1450 | $2,800 | $1.93 | 13d | 1 | 0.86mi |
| 14 Smith St Middletown, NY | 3.0 | 2.0 | 1852 | $3,600 | $1.94 | 13d | 1 | 0.90mi |
| 44 Broad St Middletown, NY | 1.0 | 1.0 | 1684 | $1,700 | $1.01 | 43d | 1 | 0.90mi |
| 52 Horton Ave Middletown, NY | 3.0 | 2.5 | 2340 | $3,000 | $1.28 | 43d | 1 | 1.05mi |
| 39 Cedar Ct Middletown, NY | 3.0 | 1.5 | 1540 | $2,350 | $1.53 | 43d | 1 | 1.29mi |
| 186 Highland Ave Unit 1 Middletown, NY | 3.0 | 2.0 | 2160 | $2,800 | $1.30 | 43d | 1 | 1.31mi |
Listing history 1 events
-
2026-04-27$359,999 Active 923-char remark
ⓘ Source: listings_history table (triggers on properties + properties_extension) + one-shot
backfill from property_details.listing_events for pre-trigger history.
Tax reassessment forecast NY · Partial reset (capped growth)
- Current annual tax
- $11,169 · $931/mo
- Projected year-2 tax
- $11,169 · $931/mo
- Expected delta
- $0/yr ($0/mo · 0.0%)
ⓘ Screening estimate from a state-policy table — verify with the county assessor before closing.
Climate risk First Street
- Flood 6/10 Major FEMA zone AE · 73% chance over 30 yrs
- Wildfire 2/10 Low
- Heat 4/10 Moderate 7 d/yr ≥99°F today · 15 d/yr by 30 yrs out
- Wind 4/10 Moderate 10% chance of damaging wind over 30 yrs
- Air quality 2/10 Low 1 unhealthy d/yr today · 2 by 30 yrs out
Nearby sold comps map
Loading sold comps map…
Walkable amenities ~0.75 mi
Loading nearby amenities…
Taxation est. · year 1
- Rental income
- $49,812
- − Mortgage interest
- −$20,166
- − Property taxes
- −$11,169
- − Insurance
- −$7,325
- − Repairs & maintenance
- −$3,985
- − Management
- −$3,985
- − Depreciation
- −$10,473
- Taxable loss
- −$7,290
- Est. tax savings @ 24.0%
- +$1,750
- After-tax cash flow
- $-47/yr
For passive investors: Depreciation is non-cash, so a rental often shows a tax loss while cash-flowing — sheltering income. Rental losses are passive: they offset passive income freely, and up to $25,000/yr can offset ordinary (W-2) income if you actively participate and your MAGI is under $100k (phasing out to $0 by $150k); unused losses carry forward. On sale, claimed depreciation is recaptured at up to 25%, and gains may owe capital-gains tax (a 1031 exchange can defer both). Figures are a year-1 estimate at your 24.0% rate — not tax advice; consult a CPA.
Schools (NCES district)
- District
- Middletown City School District
- NCES district ID
- 3619320
- Math proficiency
- 41% ▼ -2.00%
- Reading proficiency
- 55% ▲ 19.00%
- Median HH income
- $54,612
- Composite
- 41.52/100
- National rank
- #3453
- State rank
- #411 of 590 in NY
Livability — Middletown
- Score
- 82/100
- State rank
- #79
- US rank
- #1219
Category grades
Schools grade is shown separately in the Schools card above.
Census & demographics
- Census place
- Middletown, NY
- County
- Orange County · 267,004 people
- City population
- 68,033
- Metro
- Poughkeepsie-Newburgh-Middletown, NY
- Population (ZIP)
- 53,611
- Household income
- $87,080
- Rent vs Own
- Severe rent burden
- 1846.0
Population outlook (Orange County) Hauer SSP2
- Today (2025)
- 379,830 people
- By 2030
- 378,955 · -0.2%
- By 2040
- 375,444 · -1.2%
- By 2050
- 369,311 · -2.8%
- By 2075
- 354,233 · -6.7%
- By 2100
- 318,150 · -16.2%
Race, ethnicity, and origin ACS 2023
- Neighborhood character
- Highly diverse neighborhood (Simpson 0.70)
- Race & ethnicity
- White 39% Hispanic / Latino 32% Black 20% Two or more races 13% Asian 4% Native American 3%
- Hispanic origin (detail)
- Mexican 9% Puerto Rican 13% Dominican 3%
- Common ancestry
- Romanian 3% Italian 1% Iranian 1%
- Foreign-born
- 18% · Canada, China, Jamaica
- Languages at home
- 72% English-only · Spanish 21% Other Indo-European 2% Chinese 1%
Political lean MEDSL · Orange
- 2024 margin
- Lean R (+8.4) · D 45.8% · R 54.2%
- 2008→2024 swing
- -12.5pp toward R · 2008: 4.1pp · 2024: -8.4pp
- All cycles
- 2024: R+8.4 2020: R+0.2 2016: R+6.5 2012: D+5.2 2008: D+4.1
Not yet ingested
- Civics
- —
Market trends
- HPI YoY
- ▼ -71.68%
- Current HPI
- 311.5969
- Rent YoY
- ▲ 8.23%
- Metro
- Poughkeepsie-Newburgh-Middletown, NY
- State GDP YoY
- ▲ 2.60%
- F500 in state
- 92
Industry mix (Fortune 500 HQ in NY)
| Industry | F500 HQs | Revenue |
|---|---|---|
| Financial Services | 10 | $950B |
|
||
| Consumer Goods | 9 | $162B |
|
||
| Insurance | 4 | $225B |
|
||
| Telecommunications | 2 | $144B |
|
||
| Pharmaceuticals | 2 | $112B |
|
||
| Media / Entertainment | 2 | $69B |
|
||
Price history
1 event — show timeline
- 2026-04-27 Listed $359,999 OneKey® MLS as Distributed by MLS Grid
Property tax history
+1.0%/yrLatest (2025): $11,169 · -0.3% YoY. Source: county tax records.
Cash-flow waterfall
monthlySold comps — $/sqft
last 12 mo · ≤1 miLoading sold comps…