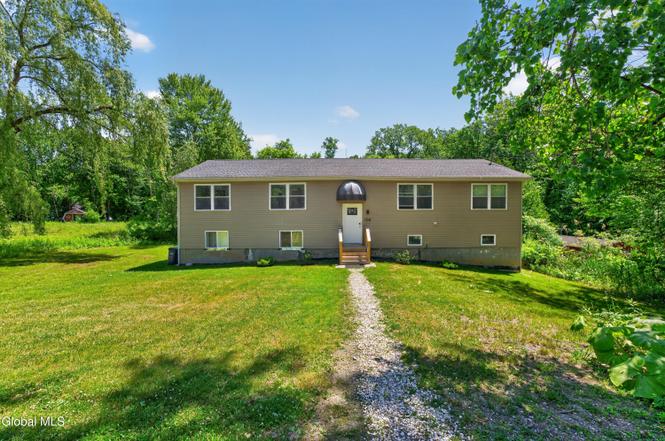
106 Dunsbach Rd
Clifton Gardens, NY 12065
$449,900C+
4 bd · 3.0 ba ·
1,620 sqft ·
Built 1990
· MultiFamily
· Pending
· 6 DOM
Cashflow @ list (25.0% down · 7.5%)
Estimated rent
$5,014/mo
Mortgage (P&I)
−$2,359
Tax + insurance
−$667
HOA
−$0
Vac / Maint / Mgmt
−$1,053
Net cashflow
$934/mo
Annual
$11,213/yr
Cap rate
8.79%
Cash-on-cash
8.90%
DSCR
1.40
1% rule
1.11%
Cash to close
$125,972
Investor read
- This is a 3 × 2.0-bed/1.0-bath units multifamily listed at $450k.
- At list price, monthly cash flow is $934 ($11k/yr) — positive. Per door: $311/mo.
- The deal already cash-flows at list — no discount required.
- Meets the 1% rule at list price ($5k rent vs $450k).
- Only 6 days on market — expect competitive offers; lowballing is unlikely to land.
- Local home prices are declining (-3.0%/yr); year-one equity from $3k of loan paydown is wiped out by about $13k of value loss. Plan a longer hold.
- Location reads: area grade C — affects rentability + tenant quality, not the cash-flow math above.
- Shenendehowa Central School District (suburban): math 72% / reading 73% proficiency, ranked #98 of 590 in NY (top 17%) — strong family-tenant draw, lease renewals of 3-5y typical; only 10% free/reduced lunch — higher-income household profile.
- Zoned schools: Shenendehowa High School (math 97% / reading 82%, grade A+, #265 of 1,100 statewide, top 26%, 3,036 students, 21% FRL).
- Zoned-school proficiency averages 90% at this address vs 72% district-wide (+17 pts) — the actual schools serving this property are materially stronger than the Shenendehowa Central School District average implies; a family-tenant draw the district grade alone would hide.
- Market conditions: Rents rising fast (+4.7%/yr); 265 active listings in the ZIP; 3 comparable units currently listed for rent nearby; rentals at typical pace (median 15d on market — plan ~3-4 weeks tenant-placement turnaround); high-income renter base; 1,132 units permitted in Saratoga County in 2024 (378 in 5+ unit buildings).
- Saratoga County population projected at +4% by 2050 — modest demand growth; plan on rents tracking national, not racing it.
- 7 sale attempts since 12y ago with the ask held roughly flat each time — persistent listings suggest the price (not the market) is what's stuck; bring a comps-based counter.
- Current owner paid $265k; list at $450k implies a 70% gain — meaningful room to come down on a strong offer.
- At projected returns (-3.0% appreciation + 4.7% rent growth), your $126k cash investment doubles in ~10 years — after that, you're playing with house money.
- Cap rate 8.8% vs local median 3.3% in Clifton Gardens — top-decile yield for the area; either an underpriced asset or a hidden risk that comps aren't pricing in. Stress-test before assuming the spread holds.
- At $5,014/mo this rent would consume 53% of the median local household income ($114k/yr) (locally 1040% of renters already pay >50% of income on rent) — very limited rent-growth headroom before tenants either downsize or default.
Questions for listing agent
- Can we see the unit-by-unit rent roll, current vacancy, and any below-market leases? What's the average tenancy length?
- What capital expenditures (roof, boiler, parking lot, exteriors) have been made in the last 5 years, and what's planned in the next 2?
- Is there a deadline driving the sale (1031 exchange, divorce, estate, relocation)? That informs how much negotiation room exists.
- What's the average days-on-market for RENTAL listings here right now (not sales)? A rising rental-DOM trend means longer vacancies and softer asking-rent achievability than the comps imply.
- What's the recent tenant-quality profile in this submarket — average credit score on applications, eviction rate, late-payment / NSF rate, and stable-employment percentage? A property-management company in the area should have these aggregated.
- How much new apartment / multifamily construction is in the pipeline within 1–3 miles? Heavy new supply (>2% of stock underway) typically softens rents 12–24 months out; light construction supports rent growth.
CashFlowRE · CFR-F1N33P5SCK6G7X
· Data 4 days ago
cashflowre.app · 2026-05-29