 Triplex
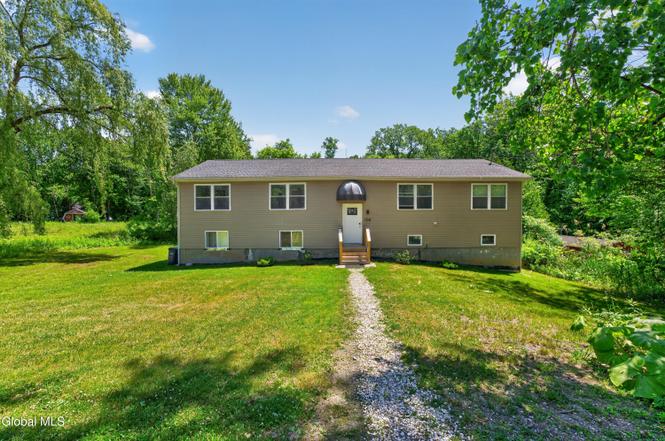
106 Dunsbach Rd · Clifton Gardens, NY
Flood risk 1/10 · Minimal
- FEMA flood zone
- X
- Chance of flooding over 30 yrs
- 0.0%
- Est. flood insurance / yr
- $473 – $860
Fire risk 3/10 · Minor
- Est. fire insurance / yr
- $691 – $1,283
Heat risk 3/10 · Minor
- Hot days now (above 96°F)
- 7 days/yr
- Hot days in 30 yrs
- 16 days/yr
Wind risk 3/10 · Minor
- Chance of severe wind over 30 yrs
- 6.0%
Air-quality risk 1/10 · Minimal
- Unhealthy air days now
- 0 days/yr
- Unhealthy air days in 30 yrs
- 0 days/yr
Risk factors via First Street. Map © Google.
Why this score? — see what drove the C+ grade
The composite is a weighted blend of 9 inputs, each scored 0–100. Each bar is that input's sub-score; the figure is the points it added to the 100-point composite (weight × sub-score).
- Cash flow +24.6/30.0
- DSCR +8.0/10.0
- ARV discount +7.5/15.0
- Schools +6.5/10.0
- 1% rule +6.1/10.0
- Rent growth +3.7/5.0
- Livability +2.5/5.0
- Condition / age +2.5/5.0
- Appreciation +0.0/10.0
$449,900
🖨 Deal sheet 📄 Offer letter ✓ Due diligence
Multi-family units
County records classify this as Multi-Family (2-4 Unit). Listing-text estimate: 3 units. confirmed
Listing remarks MLS
Large TWO-Family in Shen School District. A hard to find type of property in this area of Saratoga County. Updated kitchens and bathrooms throughout. Solid investment opportunity for future landlord or for owner-occupied plan. Call for more information, all showings need to be scheduled in advance. Very Good Condition
Key facts
- New siding
- New flooring
- Back deck
Tags
Property features AI
Finance
- Financial info: 3-unit property; Maintenance expense listed as $3,000; Tenants are responsible for hot water, heat, cable TV and electricity
Exterior
- Parking: 4 parking spaces total
- Utilities: Public water; Public sewer; Tenants pay for electricity and cable TV
- Home design: Triplex; Below-grade finished area included
- Construction: Vinyl siding; Asphalt roof
- Exterior features: Deck; Rolling slope lot
Interior
- Kitchen: Each unit includes a kitchen
- Bedrooms: Unit 1: 2 bedrooms (on 2nd floor); Unit 2: 2 bedrooms (on 2nd floor); Unit 3: 2 bedrooms (in basement)
- Flooring: Vinyl flooring throughout
- Bathrooms: Three full bathrooms total; Unit 1: 1 full bath (2nd floor); Unit 2: 1 full bath (2nd floor); Unit 3: 1 full bath (in basement)
- Heating & cooling: Electric baseboard heating; Tenants pay for heat
- Interior features: Vinyl flooring; Finished full basement
- Laundry & utility: Common-area laundry located in the basement; Tenants pay for hot water
Neighborhood map
What this means for you Summary
Snapshot
- This is a 3 × 2.0-bed/1.0-bath units multifamily listed at $450k.
Deal economics
- At list price, monthly cash flow is $934 ($11k/yr) — positive. Per door: $311/mo.
- The deal already cash-flows at list — no discount required.
- Meets the 1% rule at list price ($5k rent vs $450k).
- Cap rate 8.8% vs local median 3.3% in Clifton Gardens — top-decile yield for the area; either an underpriced asset or a hidden risk that comps aren't pricing in. Stress-test before assuming the spread holds.
Location & tenants
- Location reads: area grade C — affects rentability + tenant quality, not the cash-flow math above.
- Shenendehowa Central School District (suburban): math 72% / reading 73% proficiency, ranked #98 of 590 in NY (top 17%) — strong family-tenant draw, lease renewals of 3-5y typical; only 10% free/reduced lunch — higher-income household profile.
- Zoned schools: Shenendehowa High School (math 97% / reading 82%, grade A+, #265 of 1,100 statewide, top 26%, 3,036 students, 21% FRL).
- Zoned-school proficiency averages 90% at this address vs 72% district-wide (+17 pts) — the actual schools serving this property are materially stronger than the Shenendehowa Central School District average implies; a family-tenant draw the district grade alone would hide.
- Market conditions: Rents rising fast (+4.7%/yr); 265 active listings in the ZIP; 3 comparable units currently listed for rent nearby; rentals at typical pace (median 14d on market — plan ~3-4 weeks tenant-placement turnaround); high-income renter base; 1,132 units permitted in Saratoga County in 2024 (378 in 5+ unit buildings).
- At $5,014/mo this rent would consume 53% of the median local household income ($114k/yr) (locally 1040% of renters already pay >50% of income on rent) — very limited rent-growth headroom before tenants either downsize or default.
Forward outlook
- Local home prices are declining (-3.0%/yr); year-one equity from $3k of loan paydown is wiped out by about $13k of value loss. Plan a longer hold.
- Saratoga County population projected at +4% by 2050 — modest demand growth; plan on rents tracking national, not racing it.
- At projected returns (-3.0% appreciation + 4.7% rent growth), your $126k cash investment doubles in ~10 years — after that, you're playing with house money.
Negotiation context
- Only 6 days on market — expect competitive offers; lowballing is unlikely to land.
- 7 sale attempts since 12y ago with the ask held roughly flat each time — persistent listings suggest the price (not the market) is what's stuck; bring a comps-based counter.
- Current owner paid $265k; list at $450k implies a 70% gain — meaningful room to come down on a strong offer.
Questions for the listing agent
- Can we see the unit-by-unit rent roll, current vacancy, and any below-market leases? What's the average tenancy length?
- What capital expenditures (roof, boiler, parking lot, exteriors) have been made in the last 5 years, and what's planned in the next 2?
- Is there a deadline driving the sale (1031 exchange, divorce, estate, relocation)? That informs how much negotiation room exists.
- What's the average days-on-market for RENTAL listings here right now (not sales)? A rising rental-DOM trend means longer vacancies and softer asking-rent achievability than the comps imply.
- What's the recent tenant-quality profile in this submarket — average credit score on applications, eviction rate, late-payment / NSF rate, and stable-employment percentage? A property-management company in the area should have these aggregated.
- How much new apartment / multifamily construction is in the pipeline within 1–3 miles? Heavy new supply (>2% of stock underway) typically softens rents 12–24 months out; light construction supports rent growth.
Investment metrics
- 1% rule
- 1.11% ✓
- Cap rate
- 8.79%
- Cash-on-cash
- 8.90%
- DSCR
- 1.40
- GRM
- 7.5
CMA / ARV
- ARV (on-the-fly)
- $166,860
- Comps found
- 1
Show comp detail 1 sale within ~0.75 mi
| Address | Dist | Beds/Ba | Sqft | Sold | Price | $/sf | Match |
|---|---|---|---|---|---|---|---|
| 110 Dunsbach Rd | 0.03mi | 4/2.0 | 1,608 (-1%) | 23mo | $165,000 | $103 | 74 |
Match score weights: distance 35% · size 25% · config 20% · recency 20%. Top-matched comps best support the ARV.
Projected returns pro-forma
-3.0% appreciation · 4.65% rent growth · sell at horizon
- IRR
- -1.0%
- Equity multiple
- 0.96×
- Total profit
- $-4,904
- Equity at exit
- $67,082
- IRR
- 10.3%
- Equity multiple
- 1.86×
- Total profit
- $108,372
- Equity at exit
- $38,899
Cash invested: $125,972 (down + closing). Projections, not guarantees.
Landlord ↔ Tenant lean methodology
- Overall (STATE)
- 15 Strongly Tenant-Friendly
- State New York
- 15 Strongly Tenant-Friendly · D+10
- County
- — inherits STATE
- City
- — inherits STATE
ZIP-level market 12065
- Rents YoY
- 4.7%
- Active inventory
- 265
- Price-to-rent
- 22.4×
Monthly cashflow live
- Estimated rent
- $5,014 medium interval (Pro) →
- Mortgage (P&I)
- −$2,359
- Tax from tax record
- −$480 /mo · $5,758/yr
- Insurance
- −$187
- HOA
- −$0
- Vacancy / Maint / Mgmt
- −$1,053
- Net cashflow
- $934
Break-even live
3-unit breakdown (identical units grouped — click to expand)
| Units | Beds | Baths | Est. rent |
|---|---|---|---|
| 3× units | 2.0 | 1 | $5,013 |
| #1 | 2.0 | 1 | $1,671 |
| #2 | 2.0 | 1 | $1,671 |
| #3 | 2.0 | 1 | $1,671 |
| Total (3 units) | $5,014 | ||
UW: 25.0% down · 7.5% · 30yr · 1.5% tax · 5.0% vac · 8.0% maint · 8.0% mgmt
Financing live
Cash to close
- Down payment
- $112,475
- Closing costs
- $13,497
- Reserves months
- —
- Total cash needed
- —
Loan-product check · same deal, 3 products live
Conventional
25% down · 7.5% · 30yr
- Down + closing
- —
- Monthly P&I
- —
- Monthly cashflow
- —
- DSCR
- —
- Eligible?
- —
Personal DTI + credit; lowest rate.
DSCR
20% down · 8.5% · 30yr
- Down + closing
- —
- Monthly P&I
- —
- Monthly cashflow
- —
- DSCR
- —
- Eligible?
- —
No personal income docs; deal must DSCR.
Hard money
10% down · 12.0% · 12mo
- Down + closing
- —
- Monthly P&I
- —
- Monthly cashflow
- —
- DSCR
- —
- Eligible?
- —
Short-term bridge; refi at stabilization.
Rent comps 3 comps
| Address | Beds | Baths | Sqft | Rent | $/sqft | DOM | Units | Dist |
|---|---|---|---|---|---|---|---|---|
| 26 Ponderosa Dr Clifton Park, NY | 3.0 | 2.5 | 1408 | $2,750 | $1.95 | 19d | 1 | 0.78mi |
| 5200 Plank Rd Waterford, NY | 2.0–3.0 | 2.0 | 1100 | $1,895 | $1.72 | 14d | 1 | 1.20mi |
| 1 Sound Pl Cohoes, NY | 1.0–3.0 | 1.0–2.5 | 1787 | $2,894 | $1.62 | 14d | 17 | 1.48mi |
Listing history 5 events
-
2026-06-16statusdays on market $449,900 Pending 6 DOM
-
2026-06-15days on market $449,900 Active 5 DOM
-
2026-06-14days on market $449,900 Active 3 DOM
-
2026-06-13remarks 597-char remark
-
2026-06-13$449,900 Active 2 DOM
ⓘ Source: listings_history table (triggers on properties + properties_extension) + one-shot
backfill from property_details.listing_events for pre-trigger history.
Tax reassessment forecast NY · Partial reset (capped growth)
- Current annual tax
- $5,758 · $480/mo
- Projected year-2 tax
- $6,681 · $557/mo
- Expected delta
- +$923/yr (+$77/mo · 16.0%)
ⓘ Screening estimate from a state-policy table — verify with the county assessor before closing.
Climate risk First Street
- Flood 1/10 Low FEMA zone X · 0% chance over 30 yrs
- Wildfire 3/10 Moderate
- Heat 3/10 Moderate 7 d/yr ≥96°F today · 16 d/yr by 30 yrs out
- Wind 3/10 Moderate 6% chance of damaging wind over 30 yrs
- Air quality 1/10 Low 0 unhealthy d/yr today · 0 by 30 yrs out
Nearby sold comps map
Loading sold comps map…
Walkable amenities ~0.75 mi
Loading nearby amenities…
Taxation est. · year 1
- Rental income
- $60,168
- − Mortgage interest
- −$25,201
- − Property taxes
- −$5,758
- − Insurance
- −$2,250
- − Repairs & maintenance
- −$4,813
- − Management
- −$4,813
- − Depreciation
- −$13,088
- Taxable income
- $4,244
- Est. tax owed @ 24.0%
- −$1,019
- After-tax cash flow
- $10,194/yr
For passive investors: Depreciation is non-cash, so a rental often shows a tax loss while cash-flowing — sheltering income. Rental losses are passive: they offset passive income freely, and up to $25,000/yr can offset ordinary (W-2) income if you actively participate and your MAGI is under $100k (phasing out to $0 by $150k); unused losses carry forward. On sale, claimed depreciation is recaptured at up to 25%, and gains may owe capital-gains tax (a 1031 exchange can defer both). Figures are a year-1 estimate at your 24.0% rate — not tax advice; consult a CPA.
Schools (NCES district)
- District
- Shenendehowa Central School District
- NCES district ID
- 3626670
- Math proficiency
- 72% ▼ -6.00%
- Reading proficiency
- 73% ▲ 3.00%
- Median HH income
- $82,933
- Composite
- 64.59/100
- National rank
- #531
- State rank
- #98 of 590 in NY
Livability — Clifton Gardens
No livability data for this city. (Only ~50 U.S. cities are tracked.)
Census & demographics
- County
- Saratoga County · 166,192 people
- City population
- 44,726
- Metro
- Albany-Schenectady-Troy, NY
- Population (ZIP)
- 45,116
- Household income
- $113,873
- Rent vs Own
- Severe rent burden
- 1040.0
Population outlook (Saratoga County) Hauer SSP2
- Today (2025)
- 238,889 people
- By 2030
- 243,681 · +2.0%
- By 2040
- 249,118 · +4.3%
- By 2050
- 248,638 · +4.1%
- By 2075
- 241,675 · +1.2%
- By 2100
- 213,150 · -10.8%
Race, ethnicity, and origin ACS 2023
- Neighborhood character
- Predominantly White (81%)
- Race & ethnicity
- White 81% Asian 7% Two or more races 7% Hispanic / Latino 4% Black 2%
- Common ancestry
- Romanian 6% Lithuanian 5% Italian 2%
- Foreign-born
- 12% · Canada, China, Jamaica
- Languages at home
- 86% English-only · Other Indo-European 4% Russian/Polish/Slavic 2% Spanish 2%
Political lean MEDSL · Saratoga
- 2024 margin
- Toss-up / Even · D 50.9% · R 49.1%
- 2008→2024 swing
- -1.6pp toward R · 2008: 3.4pp · 2024: 1.8pp
- All cycles
- 2024: D+1.8 2020: D+5.4 2016: R+4.4 2012: D+2.1 2008: D+3.4
Not yet ingested
- Civics
- —
Market trends
- HPI YoY
- ▼ -201.12%
- Current HPI
- 318.0765
- Rent YoY
- ▲ 4.65%
- Metro
- Albany-Schenectady-Troy, NY
- State GDP YoY
- ▲ 2.60%
- F500 in state
- 92
Industry mix (Fortune 500 HQ in NY)
| Industry | F500 HQs | Revenue |
|---|---|---|
| Financial Services | 10 | $950B |
|
||
| Consumer Goods | 9 | $162B |
|
||
| Insurance | 4 | $225B |
|
||
| Telecommunications | 2 | $144B |
|
||
| Pharmaceuticals | 2 | $112B |
|
||
| Media / Entertainment | 2 | $69B |
|
||
Price history
+210.3% since first listed18 events — show timeline
- 2026-06-10 Listed $449,900 Global MLS
- 2021-09-24 Sold (Public Records) $265,000 Public Records
- 2021-09-17 Sold (MLS) $265,000 Global MLS
- 2021-07-22 Pending — Global MLS
- 2021-07-21 Relisted — Global MLS
- 2021-06-24 Listing Removed — Global MLS
- 2021-05-17 Listed $265,000 Global MLS
- 2020-08-24 Listing Removed — Global MLS
- 2020-07-07 Price Changed $282,000 Global MLS
- 2020-06-22 Listed $285,000 Global MLS
- 2020-05-13 Listing Removed — Global MLS
- 2020-03-11 Listed $295,000 Global MLS
- 2019-09-01 Listing Removed — Global MLS
- 2019-06-05 Listed $325,000 Global MLS
- 2017-04-25 Sold (Public Records) $210,000 Public Records
- 2016-02-19 Sold (MLS) $115,000 Global MLS
- 2015-03-23 Listing Removed — Global MLS
- 2014-08-15 Listed $145,000 Global MLS
Property tax history
+1.7%/yrLatest (2025): $5,758 · +3.8% YoY. Source: county tax records.
Cash-flow waterfall
monthlySold comps — $/sqft
last 12 mo · ≤1 miLoading sold comps…