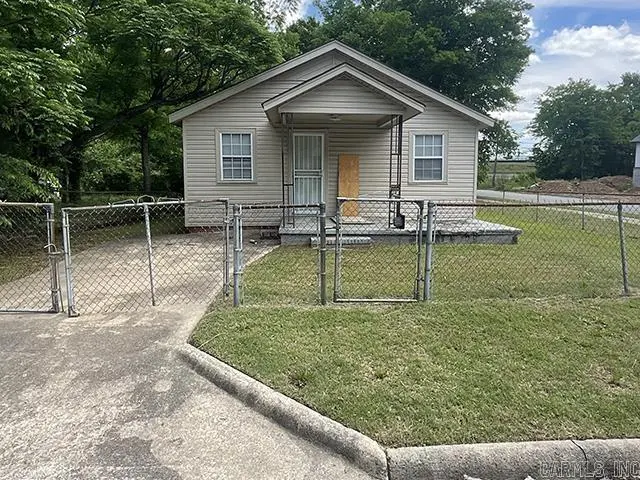
2723 Rock St
Little Rock, AR 72206
$39,000B-
2 bd · 1.0 ba ·
624 sqft ·
Built 1950
· SingleFamily
· Active
· 39 DOM
Cashflow @ list (25.0% down · 7.5%)
Estimated rent
$954/mo
Mortgage (P&I)
−$205
Tax + insurance
−$472
HOA
−$0
Vac / Maint / Mgmt
−$200
Net cashflow
$77/mo
Annual
$929/yr
Cap rate
21.80%
Cash-on-cash
55.38%
DSCR
3.46
1% rule
2.45%
Cash to close
$10,920
Investor read
- This is a 2-bed/1.0-bath single-family listed at $39k.
- At list price, monthly cash flow is $77 ($929/yr) — positive.
- The deal already cash-flows at list — no discount required.
- Meets the 1% rule at list price ($954 rent vs $39k).
- It's been on market 39 days — a 3% lower offer ($38k) is reasonable based on typical stale-listing flexibility.
- Recommended offer: $38k (3.0% below list) — sets the bar for market timing.
- Local home prices are declining (-3.0%/yr); year-one equity from $270 of loan paydown is wiped out by about $1k of value loss. Plan a longer hold.
- Location reads 73/100 on livability (#22 in AR) — a middle-class / working-renter tenant base. Strengths: commute A+, cost of living A+, housing A+; Watch: crime F.
- Little Rock School District (urban): math 23% / reading 26% proficiency, ranked #183 of 238 in AR (top 77%) — low school quality limits family demand, transient renter base, plan for 1-2y turnover; 69% free/reduced lunch — lower-income household profile, screen leases tightly.
- Zoned schools: Washington Elementary School (math 12% / reading 8%, grade F, #429 of 454 statewide, top 96%, 319 students, 97% FRL); Dunbar Magnet Middle School (math 6% / reading 13%, grade F, #196 of 201 statewide, top 98%, 320 students, 90% FRL); Little Rock Southwest High School (math 2% / reading 9%, grade F, #286 of 292 statewide, top 98%, 2,014 students, 78% FRL) — zoned schools average 88% FRL vs 69% district-wide (19 pts higher); higher-poverty schools than district average — tighter screening recommended.
- Zoned-school proficiency averages 8% at this address vs 24% district-wide (-16 pts) — the specific schools serving this property underperform the Little Rock School District average; the district grade overstates school quality for this exact location.
- Watch-outs: flood insurance adds $427/mo; built in 1950 — expect roof / HVAC / electrical / plumbing capex.
- Market conditions: Rents rising (+3.4%/yr); 126 active listings in the ZIP; 5 comparable units currently listed for rent nearby; rentals at typical pace (median 26d on market — plan ~3-4 weeks tenant-placement turnaround); 1,006 units permitted in Pulaski County in 2024 (0 in 5+ unit buildings).
- Pulaski County population projected at +6% by 2050 — modest demand growth; plan on rents tracking national, not racing it.
- At projected returns (-3.0% appreciation + 3.4% rent growth), your $11k cash investment doubles in ~10 years — after that, you're playing with house money.
- Climate carrying-cost: in FEMA flood zone AE (mandatory federal flood insurance); extreme-heat days projected 7→19/yr by 2055 (HVAC capex compounding) — expect insurance premiums to compound above CPI over the hold.
- Cap rate 21.8% vs local median 4.1% in Little Rock — top-decile yield for the area; either an underpriced asset or a hidden risk that comps aren't pricing in. Stress-test before assuming the spread holds.
Questions for listing agent
- It's been on market 39 days. Have you received any prior offers? Is the seller open to a 3% concession, seller financing, or rate buy-down credit?
- Built in 1950 — when were the roof, HVAC, electrical panel, plumbing, and water heater last replaced?
- What's the actual annual flood-insurance premium (NFIP or private), and is the property in a SFHA with mandatory coverage?
- Is there a deadline driving the sale (1031 exchange, divorce, estate, relocation)? That informs how much negotiation room exists.
- Crime grade is F in this area — have there been break-ins, vandalism, or insurance claims at this property in the last 3 years? What carrier currently insures it and at what premium?
- What's the average days-on-market for RENTAL listings here right now (not sales)? A rising rental-DOM trend means longer vacancies and softer asking-rent achievability than the comps imply.
- What's the recent tenant-quality profile in this submarket — average credit score on applications, eviction rate, late-payment / NSF rate, and stable-employment percentage? A property-management company in the area should have these aggregated.
- How much new for-sale + rental construction is in the pipeline within 1–3 miles? Heavy new supply typically softens prices + rents 12–24 months out; constrained supply supports both.
CashFlowRE · CFR-F27H1V29NYV9A0
· Data 1 day ago
cashflowre.app · 2026-05-29