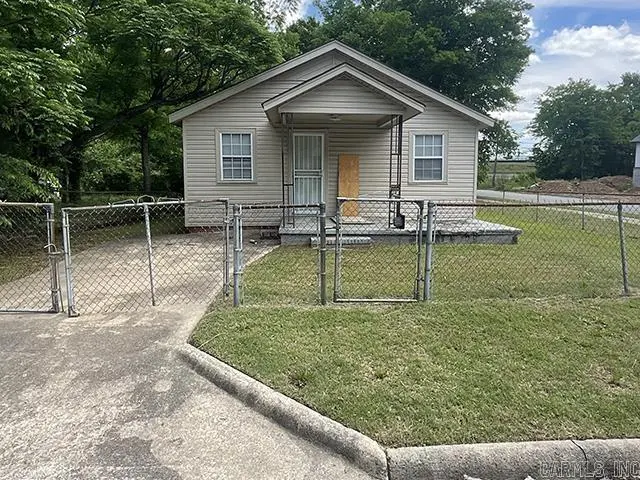
2723 Rock St · Little Rock, AR
Flood risk 7/10 · Major
- FEMA flood zone
- AE
- Chance of flooding over 30 yrs
- 0.76%
- Est. flood insurance / yr
- $1,737 – $8,500
Fire risk 1/10 · Minimal
- Est. fire insurance / yr
- $1,499 – $2,785
Heat risk 7/10 · Major
- Hot days now (above 110°F)
- 7 days/yr
- Hot days in 30 yrs
- 19 days/yr
Wind risk 4/10 · Minor
- Chance of severe wind over 30 yrs
- 10.0%
Air-quality risk 2/10 · Minimal
- Unhealthy air days now
- 1 days/yr
- Unhealthy air days in 30 yrs
- 1 days/yr
Risk factors via First Street. Map © Google.
Why this score? — see what drove the B- grade
The composite is a weighted blend of 9 inputs, each scored 0–100. Each bar is that input's sub-score; the figure is the points it added to the 100-point composite (weight × sub-score).
- Cash flow +30.0/30.0
- 1% rule +10.0/10.0
- DSCR +10.0/10.0
- ARV discount +7.5/15.0
- Livability +3.7/5.0
- Rent growth +3.3/5.0
- Condition / age +2.5/5.0
- Schools +2.1/10.0
- Appreciation +0.0/10.0
$39,000
🖨 Deal sheet (PDF) 📄 Offer letter ✓ Due diligence
Listing remarks
Opportunity in the growing Pettaway area! Renovations have already been started on this 2-bedroom, 1-bath home, making it a great option for an investor, flipper, or buyer looking to finish out a project with upside potential. Conveniently located near major interstates, area hospitals, and just minutes from both downtown Little Rock and North Little Rock. Enjoy easy access to local favorites with Pettaway Square within walking distance and SOMA just a short bike ride away. With its central location and continued development nearby, this property offers strong potential for rental income, resale, or owner-occupant renovation. Property is being sold as-is/where-is. No seller property disclos
Key facts
- Central location
- Renovations started
- Conveniently located
Tags
Property features AI
Finance
- Other: Approx. 0.16 acres (141' x 50' x 141' x 50'); Approx. 624 square feet (per tax records)
- Financial info: Financing available: conventional loan, cash, or in-house financing
Exterior
- Parking: Parking pads
- Utilities: Public water; Municipal electric (Entergy); Natural gas
- Home design: Frame construction
- Construction: Frame exterior; Composition roof; Piers foundation
- Exterior features: Level lot; Paved road access; Inside city limits
Interior
- Flooring: Wood flooring
- Bathrooms: 1 full bathroom
- Heating & cooling: Other heating/air (see remarks)
- Interior features: Sun room; Wood floors; Heat/AC: other (see remarks)
Neighborhood map
What this means for you Summary
Snapshot
- This is a 2-bed/1.0-bath single-family listed at $39k.
Deal economics
- At list price, monthly cash flow is $77 ($929/yr) — positive.
- The deal already cash-flows at list — no discount required.
- Meets the 1% rule at list price ($954 rent vs $39k).
- Recommended offer: $38k (3.0% below list) — sets the bar for market timing.
- Cap rate 21.8% vs local median 4.1% in Little Rock — top-decile yield for the area; either an underpriced asset or a hidden risk that comps aren't pricing in. Stress-test before assuming the spread holds.
Location & tenants
- Location reads 73/100 on livability (#22 in AR) — a middle-class / working-renter tenant base. Strengths: commute A+, cost of living A+, housing A+; Watch: crime F.
- Little Rock School District (urban): math 23% / reading 26% proficiency, ranked #183 of 238 in AR (top 77%) — low school quality limits family demand, transient renter base, plan for 1-2y turnover; 69% free/reduced lunch — lower-income household profile, screen leases tightly.
- Zoned schools: Washington Elementary School (math 12% / reading 8%, grade F, #429 of 454 statewide, top 96%, 319 students, 97% FRL); Dunbar Magnet Middle School (math 6% / reading 13%, grade F, #196 of 201 statewide, top 98%, 320 students, 90% FRL); Little Rock Southwest High School (math 2% / reading 9%, grade F, #286 of 292 statewide, top 98%, 2,014 students, 78% FRL) — zoned schools average 88% FRL vs 69% district-wide (19 pts higher); higher-poverty schools than district average — tighter screening recommended.
- Zoned-school proficiency averages 8% at this address vs 24% district-wide (-16 pts) — the specific schools serving this property underperform the Little Rock School District average; the district grade overstates school quality for this exact location.
- Market conditions: Rents rising (+3.4%/yr); 126 active listings in the ZIP; 5 comparable units currently listed for rent nearby; rentals at typical pace (median 25d on market — plan ~3-4 weeks tenant-placement turnaround); 1,006 units permitted in Pulaski County in 2024 (0 in 5+ unit buildings).
Forward outlook
- Local home prices are declining (-3.0%/yr); year-one equity from $270 of loan paydown is wiped out by about $1k of value loss. Plan a longer hold.
- Pulaski County population projected at +6% by 2050 — modest demand growth; plan on rents tracking national, not racing it.
- At projected returns (-3.0% appreciation + 3.4% rent growth), your $11k cash investment doubles in ~10 years — after that, you're playing with house money.
Negotiation context
- It's been on market 39 days — a 3% lower offer ($38k) is reasonable based on typical stale-listing flexibility.
Risks & watch-outs
- Watch-outs: flood insurance adds $427/mo; built in 1950 — expect roof / HVAC / electrical / plumbing capex.
- Climate carrying-cost: in FEMA flood zone AE (mandatory federal flood insurance); extreme-heat days projected 7→19/yr by 2055 (HVAC capex compounding) — expect insurance premiums to compound above CPI over the hold.
Questions for the listing agent
- It's been on market 39 days. Have you received any prior offers? Is the seller open to a 3% concession, seller financing, or rate buy-down credit?
- Built in 1950 — when were the roof, HVAC, electrical panel, plumbing, and water heater last replaced?
- What's the actual annual flood-insurance premium (NFIP or private), and is the property in a SFHA with mandatory coverage?
- Is there a deadline driving the sale (1031 exchange, divorce, estate, relocation)? That informs how much negotiation room exists.
- Crime grade is F in this area — have there been break-ins, vandalism, or insurance claims at this property in the last 3 years? What carrier currently insures it and at what premium?
- What's the average days-on-market for RENTAL listings here right now (not sales)? A rising rental-DOM trend means longer vacancies and softer asking-rent achievability than the comps imply.
- What's the recent tenant-quality profile in this submarket — average credit score on applications, eviction rate, late-payment / NSF rate, and stable-employment percentage? A property-management company in the area should have these aggregated.
- How much new for-sale + rental construction is in the pipeline within 1–3 miles? Heavy new supply typically softens prices + rents 12–24 months out; constrained supply supports both.
Investment metrics
- 1% rule
- 2.45% ✓
- Cap rate
- 21.80%
- Cash-on-cash
- 55.38%
- DSCR
- 3.46
- GRM
- 3.4
CMA / ARV
- ARV (median comp)
- $102,987
- List price
- $39,000
- Delta
- -62.13%
- Verdict
- UNDERPRICED
- Comps
- 11 within 1.0 mi
Projected returns pro-forma
-3.0% appreciation · 3.36% rent growth · sell at horizon
- IRR
- -1.9%
- Equity multiple
- 0.93×
- Total profit
- $-778
- Equity at exit
- $5,815
- IRR
- 9.2%
- Equity multiple
- 1.75×
- Total profit
- $8,179
- Equity at exit
- $3,372
Cash invested: $10,920 (down + closing). Projections, not guarantees.
Landlord ↔ Tenant lean methodology
- Overall (STATE)
- 92 Strongly Landlord-Friendly
- State Arkansas
- 92 Strongly Landlord-Friendly · R+14
- County
- — inherits STATE
- City
- — inherits STATE
ZIP-level market 72206
- Rents YoY
- 3.4%
- Active inventory
- 126
- Price-to-rent
- 3.4×
Monthly cashflow live
- Estimated rent
- $954 high interval (Pro) →
- Mortgage (P&I)
- −$205
- Tax from tax record
- −$29 /mo · $345/yr
- Insurance
- −$16
- Flood insurance flood zone
- −$427 /mo · $5,118/yr
- HOA
- −$0
- Vacancy / Maint / Mgmt
- −$200
- Net cashflow
- $77
Break-even live
Sensitivity live
| Price | -10% $100 | -5% $88 | +0% $77 | +5% $66 | +10% $55 |
|---|---|---|---|---|---|
| Rent | -10% $2 | -5% $40 | +0% $77 | +5% $115 | +10% $153 |
| Rate | -1.0pp $97 | -0.5pp $87 | base $77 | +0.5pp $67 | +1.0pp $57 |
UW: 25.0% down · 7.5% · 30yr · 1.5% tax · 5.0% vac · 8.0% maint · 8.0% mgmt
Financing live
Cash to close
- Down payment
- $9,750
- Closing costs
- $1,170
- Reserves months
- —
- Total cash needed
- —
Loan-product check · same deal, 3 products live
Conventional
25% down · 7.5% · 30yr
- Down + closing
- —
- Monthly P&I
- —
- Monthly cashflow
- —
- DSCR
- —
- Eligible?
- —
Personal DTI + credit; lowest rate.
DSCR
20% down · 8.5% · 30yr
- Down + closing
- —
- Monthly P&I
- —
- Monthly cashflow
- —
- DSCR
- —
- Eligible?
- —
No personal income docs; deal must DSCR.
Hard money
10% down · 12.0% · 12mo
- Down + closing
- —
- Monthly P&I
- —
- Monthly cashflow
- —
- DSCR
- —
- Eligible?
- —
Short-term bridge; refi at stabilization.
Rent comps 5 comps
| Address | Beds | Baths | Sqft | Rent | $/sqft | DOM | Units | Dist |
|---|---|---|---|---|---|---|---|---|
| 3122 S Arch St Little Rock, AR | 2.0 | 1.0 | 654 | $725 | $1.11 | 25d | 1 | 0.68mi |
| 901 W Charles Bussey Ave Unit C Little Rock, AR | 1.0 | 1.0 | 686 | $895 | $1.30 | 15d | 1 | 0.94mi |
| 1302 Scott St Unit 303B Little Rock, AR | 1.0 | 1.0 | 562 | $1,015 | $1.81 | 25d | 1 | 0.95mi |
| 700 E 9th St Unit 4J Little Rock, AR | 1.0 | 1.0 | 691 | $1,250 | $1.81 | 45d | 1 | 1.30mi |
| 623 Sherman St Little Rock, AR | 1.0 | 1.0 | 725 | $950 | $1.31 | 15d | 1 | 1.37mi |
Listing history 17 events
-
2026-06-21days on market $39,000 Active 39 DOM
-
2026-06-18days on market $39,000 Active 36 DOM
-
2026-06-17days on market $39,000 Active 35 DOM
-
2026-06-16days on market $39,000 Active 34 DOM
-
2026-06-15days on market $39,000 Active 33 DOM
-
2026-06-14days on market $39,000 Active 31 DOM
-
2026-06-13days on market $39,000 Active 30 DOM
-
2026-06-10days on market $39,000 Active 28 DOM
-
2026-06-09days on market $39,000 Active 27 DOM
-
2026-06-08days on market $39,000 Active 26 DOM
-
2026-06-05days on market $39,000 Active 22 DOM
-
2026-06-03days on market $39,000 Active 21 DOM
-
2026-06-02days on market $39,000 Active 20 DOM
-
2026-06-01days on market $39,000 Active 19 DOM
-
2026-05-31days on market $39,000 Active 18 DOM
-
2026-05-31days on market $39,000 Active 17 DOM
-
2026-05-13$39,000 New Listing 792-char remark
ⓘ Source: listings_history table (triggers on properties + properties_extension) + one-shot
backfill from property_details.listing_events for pre-trigger history.
Tax reassessment forecast AR · Resets to sale price
- Current annual tax
- $345 · $29/mo
- Projected year-2 tax
- $345 · $29/mo
- Expected delta
- $0/yr ($0/mo · 0.0%)
ⓘ Screening estimate from a state-policy table — verify with the county assessor before closing.
Climate risk First Street
- Flood 7/10 Severe FEMA zone AE · 76% chance over 30 yrs
- Wildfire 1/10 Low
- Heat 7/10 Severe 7 d/yr ≥110°F today · 19 d/yr by 30 yrs out
- Wind 4/10 Moderate 10% chance of damaging wind over 30 yrs
- Air quality 2/10 Low 1 unhealthy d/yr today · 1 by 30 yrs out
Nearby sold comps map
Loading sold comps map…
Walkable amenities ~0.75 mi
Loading nearby amenities…
Taxation est. · year 1
- Rental income
- $11,445
- − Mortgage interest
- −$2,185
- − Property taxes
- −$345
- − Insurance
- −$5,314
- − Repairs & maintenance
- −$916
- − Management
- −$916
- − Depreciation
- −$1,135
- Taxable income
- $636
- Est. tax owed @ 24.0%
- −$153
- After-tax cash flow
- $776/yr
For passive investors: Depreciation is non-cash, so a rental often shows a tax loss while cash-flowing — sheltering income. Rental losses are passive: they offset passive income freely, and up to $25,000/yr can offset ordinary (W-2) income if you actively participate and your MAGI is under $100k (phasing out to $0 by $150k); unused losses carry forward. On sale, claimed depreciation is recaptured at up to 25%, and gains may owe capital-gains tax (a 1031 exchange can defer both). Figures are a year-1 estimate at your 24.0% rate — not tax advice; consult a CPA.
Schools (NCES district)
- District
- Little Rock School District
- NCES district ID
- 0509000
- Math proficiency
- 23% ▼ -12.00%
- Reading proficiency
- 26% ▼ -8.00%
- Median HH income
- $43,346
- Composite
- 21.0/100
- National rank
- #8457
- State rank
- #183 of 238 in AR
Livability — Little Rock
- Score
- 73/100
- State rank
- #22
- US rank
- #5295
Category grades
Schools grade is shown separately in the Schools card above.
Census & demographics
- Census place
- Little Rock, AR
- County
- Pulaski County · 372,764 people
- City population
- 218,896
- Metro
- Little Rock-North Little Rock-Conway, AR
- Population (ZIP)
- 22,667
- Household income
- $52,132
- Rent vs Own
- Severe rent burden
- 623.0
Population outlook (Pulaski County) Hauer SSP2
- Today (2025)
- 415,378 people
- By 2030
- 423,720 · +2.0%
- By 2040
- 435,182 · +4.8%
- By 2050
- 440,904 · +6.1%
- By 2075
- 445,521 · +7.3%
- By 2100
- 419,173 · +0.9%
Race, ethnicity, and origin ACS 2023
- Neighborhood character
- Diverse neighborhood (Simpson 0.59)
- Race & ethnicity
- Black 48% White 43% Two or more races 6% Hispanic / Latino 5%
- Hispanic origin (detail)
- Mexican 4%
- Common ancestry
- Iranian 1% Italian 1% Lithuanian 1%
- Foreign-born
- 1% · Canada
- Languages at home
- 94% English-only · Spanish 5%
Political lean MEDSL · Pulaski
- 2024 margin
- Strong D (+22.1) · D 59.8% · R 37.7% · Other 2.5%
- 2008→2024 swing
- +10.6pp toward D · 2008: 11.6pp · 2024: 22.1pp
- All cycles
- 2024: D+22.1 2020: D+22.5 2016: D+17.9 2012: D+11.4 2008: D+11.6
Not yet ingested
- Civics
- —
Market trends
- HPI YoY
- ▼ -88.64%
- Current HPI
- 158.3601
- Rent YoY
- ▲ 3.36%
- Metro
- Little Rock-North Little Rock-Conway, AR
- State GDP YoY
- ▲ 3.80%
- F500 in state
- 10
Industry mix (Fortune 500 HQ in AR)
| Industry | F500 HQs | Revenue |
|---|---|---|
| Retail | 1 | $681B |
|
||
| Food / Agriculture | 1 | $53B |
|
||
| Retail / Energy | 1 | $22B |
|
||
| Transportation / Logistics | 1 | $12B |
|
||
| Energy | 1 | $4B |
|
||
Price history
1 event — show timeline
- 2026-05-13 Listed $39,000 CARMLS
Property tax history
+3.3%/yrLatest (2025): $345 · +7.6% YoY. Source: county tax records.
Cash-flow waterfall
monthlySold comps — $/sqft
last 12 mo · ≤1 miLoading sold comps…