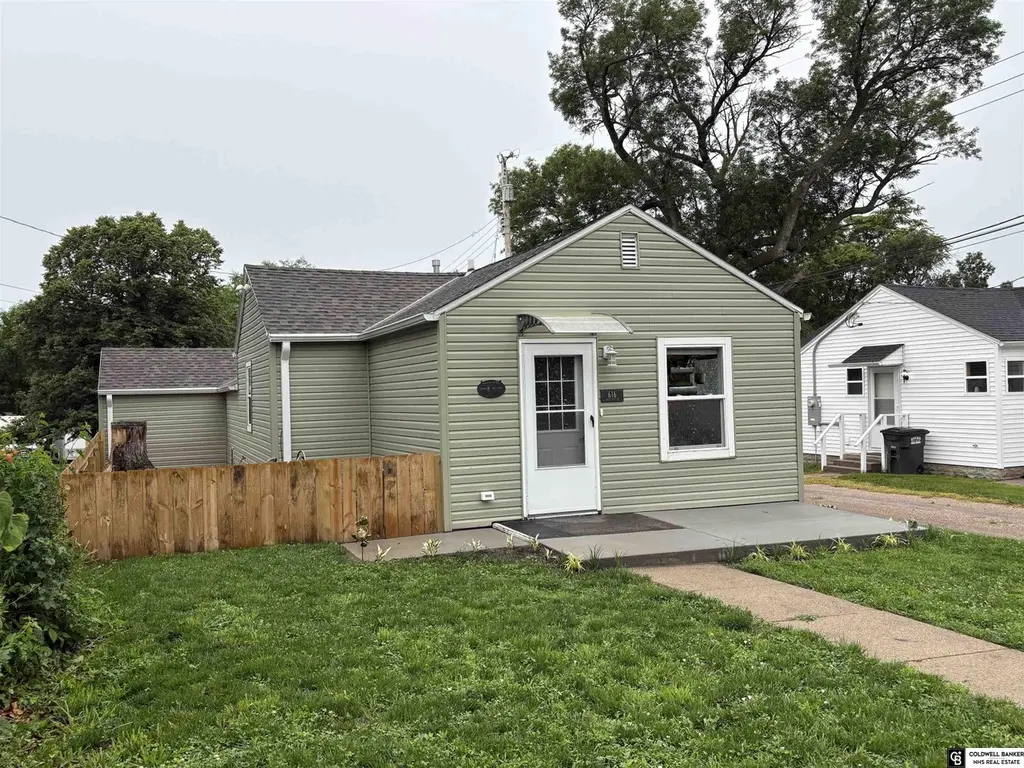
616 E 4th St
York, NE 68467
$119,000D
1 bd · 1.0 ba ·
701 sqft ·
Built 1947
· SingleFamily
· Pending
· 1 DOM
Cashflow @ list (25.0% down · 7.5%)
Estimated rent
$1,054/mo
Mortgage (P&I)
−$624
Tax + insurance
−$118
HOA
−$0
Vac / Maint / Mgmt
−$221
Net cashflow
$91/mo
Annual
$1,089/yr
Cap rate
7.21%
Cash-on-cash
3.27%
DSCR
1.15
1% rule
0.89%
Cash to close
$33,320
Investor read
- This is a 1-bed/1.0-bath single-family listed at $119k.
- At list price, monthly cash flow is $91 ($1k/yr) — positive.
- The deal already cash-flows at list — no discount required.
- To meet the 1% rule (rent ≥ 1% of price), the offer needs to be $105k (11.4% below list).
- Only 1 days on market — expect competitive offers; lowballing is unlikely to land.
- Recommended offer: $105k (11.4% below list) — sets the bar for 1% rule.
- Local home prices are declining (-3.0%/yr); year-one equity from $823 of loan paydown is wiped out by about $4k of value loss. Plan a longer hold.
- Location reads 80/100 on livability (#24 in NE, #1,666 nationally) — a professional / high-income tenant draw. Strengths: cost of living A+, housing A+, health & safety A+; Watch: amenities F, commute F.
- York Public Schools (town): math 55% / reading 51% proficiency, ranked #55 of 111 in NE (top 50%) — acceptable for families but not a draw, mixed tenant base, ~2y average lease.
- Zoned schools: York Elementary School (math 58% / reading 50%, grade C, #194 of 502 statewide, top 39%, 594 students, 50% FRL); York Middle School (math 54% / reading 52%, grade C+, #41 of 128 statewide, top 32%, 315 students, 44% FRL); York High School (math 52% / reading 47%, grade D, #107 of 261 statewide, top 52%, 522 students, 39% FRL).
- Watch-outs: built in 1947 — expect roof / HVAC / electrical / plumbing capex.
- Market conditions: 75 active listings in the ZIP; 29 units permitted in York County in 2024 (0 in 5+ unit buildings).
- York County population projected at +8% by 2050 — modest demand growth; plan on rents tracking national, not racing it.
- 4 sale attempts since 5y ago with the ask held roughly flat each time — persistent listings suggest the price (not the market) is what's stuck; bring a comps-based counter.
- Cap rate 7.2% vs local median 3.2% in York — top-decile yield for the area; either an underpriced asset or a hidden risk that comps aren't pricing in. Stress-test before assuming the spread holds.
Questions for listing agent
- Built in 1947 — when were the roof, HVAC, electrical panel, plumbing, and water heater last replaced?
- Is there a deadline driving the sale (1031 exchange, divorce, estate, relocation)? That informs how much negotiation room exists.
- Schools are A-rated — typically a magnet for longer-tenancy family renters. What's the average tenant stay here, and is there a school-zone premium baked into asking?
- The area grade is low — what's the realistic commute time and amenity access for the typical tenant pool here? Any planned neighborhood developments (good or bad) we should know about?
- What's the average days-on-market for RENTAL listings here right now (not sales)? A rising rental-DOM trend means longer vacancies and softer asking-rent achievability than the comps imply.
- What's the recent tenant-quality profile in this submarket — average credit score on applications, eviction rate, late-payment / NSF rate, and stable-employment percentage? A property-management company in the area should have these aggregated.
- How much new for-sale + rental construction is in the pipeline within 1–3 miles? Heavy new supply typically softens prices + rents 12–24 months out; constrained supply supports both.
CashFlowRE · CFR-F2GEC49D774EB4
· Data 2 weeks ago
cashflowre.app · 2026-05-29