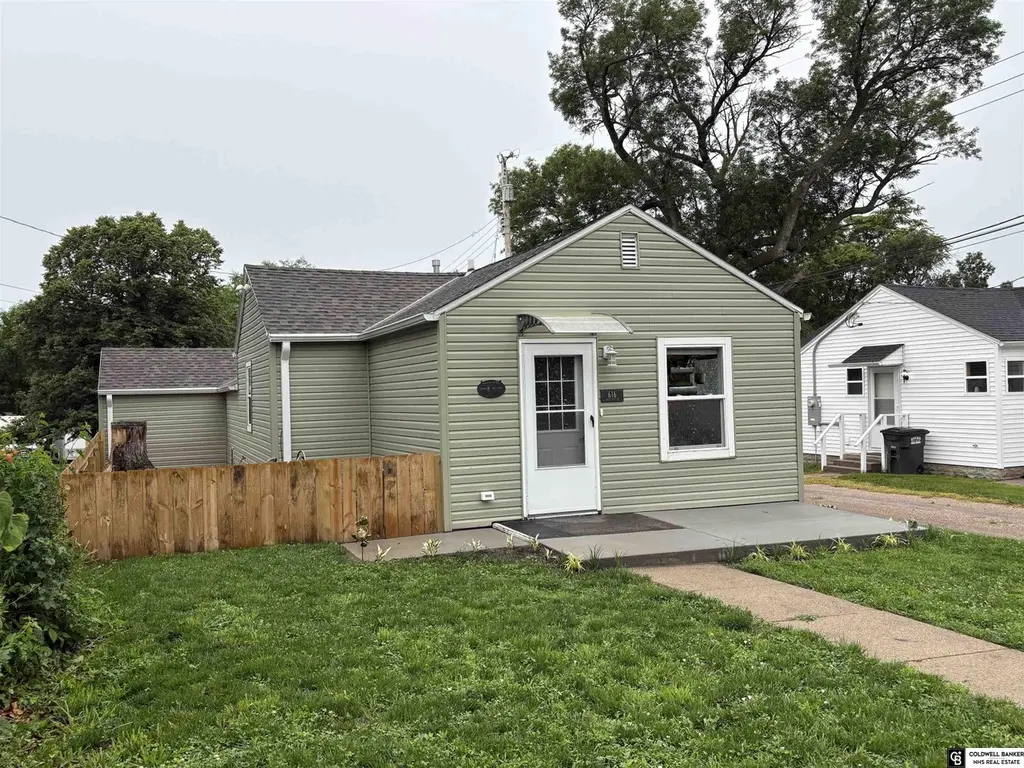
616 E 4th St · York, NE
Flood risk 1/10 · Minimal
- FEMA flood zone
- X (unshaded)
- Chance of flooding over 30 yrs
- 0.0%
- Est. flood insurance / yr
- $507 – $1,088
Fire risk 1/10 · Minimal
- Est. fire insurance / yr
- $1,161 – $2,155
Heat risk 3/10 · Minor
- Hot days now (above 104°F)
- 7 days/yr
- Hot days in 30 yrs
- 15 days/yr
Wind risk 2/10 · Minimal
- Chance of severe wind over 30 yrs
- —
Air-quality risk 1/10 · Minimal
- Unhealthy air days now
- 0 days/yr
- Unhealthy air days in 30 yrs
- 0 days/yr
Risk factors via First Street. Map © Google.
Why this score? — see what drove the D grade
The composite is a weighted blend of 9 inputs, each scored 0–100. Each bar is that input's sub-score; the figure is the points it added to the 100-point composite (weight × sub-score).
- Cash flow +17.5/30.0
- DSCR +5.5/10.0
- Schools +4.5/10.0
- Livability +4.0/5.0
- 1% rule +3.9/10.0
- Rent growth +2.5/5.0
- Condition / age +2.5/5.0
- ARV discount +0.2/15.0
- Appreciation +0.0/10.0
$119,000
🖨 Deal sheet (PDF) 📄 Offer letter ✓ Due diligence
Listing remarks MLS
Must see one bedroom, one bathroom home with attached single car garage! Completely remodeled home. Everything has been redone down to the subfloors and beautifully updated. New siding, roof and gutters as well. Call your Realtor to schedule a showing today!
Key facts
- 2,614 sq ft lot
- Garage
- Built 1947
Property features AI
Exterior
- Parking: Attached covered garage (1 car)
- Utilities: Public water; Public sewer
- Home design: Single-family residential home; Not new or a model; Built in 1947; One story; Living area approximately 637 square feet
- Construction: Block foundation
- Exterior features: Patio; Wood fencing; Lot up to 1/4 acre; Lot dimensions approximately 30 x 90 x 30 x 90
Interior
- Bedrooms: Master bedroom on the main floor
- Bathrooms: One bathroom (main level)
- Heating & cooling: Natural gas forced air heating; Central air conditioning
- Interior features: No basement; No fireplaces
Neighborhood map
What this means for you Summary
Snapshot
- This is a 1-bed/1.0-bath single-family listed at $119k.
Deal economics
- At list price, monthly cash flow is $91 ($1k/yr) — positive.
- The deal already cash-flows at list — no discount required.
- To meet the 1% rule (rent ≥ 1% of price), the offer needs to be $105k (11.4% below list).
- Recommended offer: $105k (11.4% below list) — sets the bar for 1% rule.
- Cap rate 7.2% vs local median 3.2% in York — top-decile yield for the area; either an underpriced asset or a hidden risk that comps aren't pricing in. Stress-test before assuming the spread holds.
Location & tenants
- Location reads 80/100 on livability (#24 in NE, #1,666 nationally) — a professional / high-income tenant draw. Strengths: cost of living A+, housing A+, health & safety A+; Watch: amenities F, commute F.
- York Public Schools (town): math 55% / reading 51% proficiency, ranked #55 of 111 in NE (top 50%) — acceptable for families but not a draw, mixed tenant base, ~2y average lease.
- Zoned schools: York Elementary School (math 58% / reading 50%, grade C, #194 of 502 statewide, top 39%, 594 students, 50% FRL); York Middle School (math 54% / reading 52%, grade C+, #41 of 128 statewide, top 32%, 315 students, 44% FRL); York High School (math 52% / reading 47%, grade D, #107 of 261 statewide, top 52%, 522 students, 39% FRL).
- Market conditions: 75 active listings in the ZIP; 29 units permitted in York County in 2024 (0 in 5+ unit buildings).
Forward outlook
- Local home prices are declining (-3.0%/yr); year-one equity from $823 of loan paydown is wiped out by about $4k of value loss. Plan a longer hold.
- York County population projected at +8% by 2050 — modest demand growth; plan on rents tracking national, not racing it.
Negotiation context
- Only 1 days on market — expect competitive offers; lowballing is unlikely to land.
- 4 sale attempts since 5y ago with the ask held roughly flat each time — persistent listings suggest the price (not the market) is what's stuck; bring a comps-based counter.
Risks & watch-outs
- Watch-outs: built in 1947 — expect roof / HVAC / electrical / plumbing capex.
Questions for the listing agent
- Built in 1947 — when were the roof, HVAC, electrical panel, plumbing, and water heater last replaced?
- Is there a deadline driving the sale (1031 exchange, divorce, estate, relocation)? That informs how much negotiation room exists.
- Schools are A-rated — typically a magnet for longer-tenancy family renters. What's the average tenant stay here, and is there a school-zone premium baked into asking?
- The area grade is low — what's the realistic commute time and amenity access for the typical tenant pool here? Any planned neighborhood developments (good or bad) we should know about?
- What's the average days-on-market for RENTAL listings here right now (not sales)? A rising rental-DOM trend means longer vacancies and softer asking-rent achievability than the comps imply.
- What's the recent tenant-quality profile in this submarket — average credit score on applications, eviction rate, late-payment / NSF rate, and stable-employment percentage? A property-management company in the area should have these aggregated.
- How much new for-sale + rental construction is in the pipeline within 1–3 miles? Heavy new supply typically softens prices + rents 12–24 months out; constrained supply supports both.
Investment metrics
- 1% rule
- 0.89% ✗
- Cap rate
- 7.21%
- Cash-on-cash
- 3.27%
- DSCR
- 1.15
- GRM
- 9.4
CMA / ARV
- ARV (on-the-fly)
- $102,346
- Comps found
- 4
Show comp detail 4 sales within ~0.75 mi
| Address | Dist | Beds/Ba | Sqft | Sold | Price | $/sf | Match |
|---|---|---|---|---|---|---|---|
| 120 N Iowa Ave | 0.18mi | 2/1.0 (+1) | 722 (+3%) | 7mo | $90,000 | $125 | 76 |
| 320 E 4th St | 0.18mi | 2/1.0 (+1) | 770 (+10%) | 5mo | $90,000 | $117 | 66 |
| 936 E 4th St | 0.27mi | 2/1.0 (+1) | 720 (+3%) | 18mo | $105,000 | $146 | 63 |
| 1320 N Iowa Ave | 0.65mi | 2/2.0 (+1) | 720 (+3%) | 24mo | $123,700 | $172 | 36 |
Match score weights: distance 35% · size 25% · config 20% · recency 20%. Top-matched comps best support the ARV.
Projected returns pro-forma
-3.0% appreciation · 3.0% rent growth · sell at horizon
- IRR
- -11.2%
- Equity multiple
- 0.59×
- Total profit
- $-13,535
- Equity at exit
- $17,743
- IRR
- -2.0%
- Equity multiple
- 0.87×
- Total profit
- $-4,479
- Equity at exit
- $10,289
Cash invested: $33,320 (down + closing). Projections, not guarantees.
Landlord ↔ Tenant lean methodology
- Overall (STATE)
- 83 Strongly Landlord-Friendly
- State Nebraska
- 83 Strongly Landlord-Friendly · R+13
- County
- — inherits STATE
- City
- — inherits STATE
ZIP-level market 68467
- Active inventory
- 75
- Price-to-rent
- 9.4×
Monthly cashflow live
- Estimated rent
- $1,054 medium interval (Pro) →
- Mortgage (P&I)
- −$624
- Tax from tax record
- −$68 /mo · $817/yr
- Insurance
- −$50
- HOA
- −$0
- Vacancy / Maint / Mgmt
- −$221
- Net cashflow
- $91
Break-even live
Sensitivity live
| Price | -10% $158 | -5% $124 | +0% $91 | +5% $57 | +10% $23 |
|---|---|---|---|---|---|
| Rent | -10% $8 | -5% $49 | +0% $91 | +5% $132 | +10% $174 |
| Rate | -1.0pp $151 | -0.5pp $121 | base $91 | +0.5pp $60 | +1.0pp $29 |
UW: 25.0% down · 7.5% · 30yr · 1.5% tax · 5.0% vac · 8.0% maint · 8.0% mgmt
Financing live
Cash to close
- Down payment
- $29,750
- Closing costs
- $3,570
- Reserves months
- —
- Total cash needed
- —
Loan-product check · same deal, 3 products live
Conventional
25% down · 7.5% · 30yr
- Down + closing
- —
- Monthly P&I
- —
- Monthly cashflow
- —
- DSCR
- —
- Eligible?
- —
Personal DTI + credit; lowest rate.
DSCR
20% down · 8.5% · 30yr
- Down + closing
- —
- Monthly P&I
- —
- Monthly cashflow
- —
- DSCR
- —
- Eligible?
- —
No personal income docs; deal must DSCR.
Hard money
10% down · 12.0% · 12mo
- Down + closing
- —
- Monthly P&I
- —
- Monthly cashflow
- —
- DSCR
- —
- Eligible?
- —
Short-term bridge; refi at stabilization.
Listing history 2 events
-
2026-06-07remarks 394-char remark
-
2026-06-07$119,000 Pending 1 DOM
ⓘ Source: listings_history table (triggers on properties + properties_extension) + one-shot
backfill from property_details.listing_events for pre-trigger history.
Tax reassessment forecast NE · Resets to sale price
- Current annual tax
- $817 · $68/mo
- Projected year-2 tax
- $2,059 · $172/mo
- Expected delta
- +$1,242/yr (+$103/mo · 152.0%)
ⓘ Screening estimate from a state-policy table — verify with the county assessor before closing.
Climate risk First Street
- Flood 1/10 Low FEMA zone X (unshaded) · 0% chance over 30 yrs
- Wildfire 1/10 Low
- Heat 3/10 Moderate 7 d/yr ≥104°F today · 15 d/yr by 30 yrs out
- Wind 2/10 Low
- Air quality 1/10 Low 0 unhealthy d/yr today · 0 by 30 yrs out
Nearby sold comps map
Loading sold comps map…
Walkable amenities ~0.75 mi
Loading nearby amenities…
Taxation est. · year 1
- Rental income
- $12,645
- − Mortgage interest
- −$6,666
- − Property taxes
- −$817
- − Insurance
- −$595
- − Repairs & maintenance
- −$1,012
- − Management
- −$1,012
- − Depreciation
- −$3,462
- Taxable loss
- −$918
- Est. tax savings @ 24.0%
- +$220
- After-tax cash flow
- $1,309/yr
For passive investors: Depreciation is non-cash, so a rental often shows a tax loss while cash-flowing — sheltering income. Rental losses are passive: they offset passive income freely, and up to $25,000/yr can offset ordinary (W-2) income if you actively participate and your MAGI is under $100k (phasing out to $0 by $150k); unused losses carry forward. On sale, claimed depreciation is recaptured at up to 25%, and gains may owe capital-gains tax (a 1031 exchange can defer both). Figures are a year-1 estimate at your 24.0% rate — not tax advice; consult a CPA.
Schools (NCES district)
- District
- York Public Schools
- NCES district ID
- 3179050
- Math proficiency
- 55% ▼ -9.00%
- Reading proficiency
- 51% ▼ -4.00%
- Median HH income
- $48,726
- Composite
- 45.18/100
- National rank
- #2675
- State rank
- #55 of 111 in NE
Livability — York
- Score
- 80/100
- State rank
- #24
- US rank
- #1666
Category grades
Schools grade is shown separately in the Schools card above.
Census & demographics
- Census place
- York, NE
- City population
- 9,688
- Population (ZIP)
- 9,688
Population outlook (York County) Hauer SSP2
- Today (2025)
- 13,976 people
- By 2030
- 14,103 · +0.9%
- By 2040
- 14,490 · +3.7%
- By 2050
- 15,059 · +7.7%
- By 2075
- 18,276 · +30.8%
- By 2100
- 21,449 · +53.5%
Race, ethnicity, and origin ACS 2023
- Neighborhood character
- Predominantly White (88%)
- Race & ethnicity
- White 88% Hispanic / Latino 7% Two or more races 6% Black 1%
- Hispanic origin (detail)
- Mexican 3% Puerto Rican 1%
- Common ancestry
- Iranian 2% Romanian 1% Italian 1%
- Foreign-born
- 3% · Canada
- Languages at home
- 94% English-only · Spanish 4% Other Asian/Pacific 1%
Political lean MEDSL · York
- 2024 margin
- Solid R (+51.3) · D 23.6% · R 74.9% · Other 1.5%
- 2008→2024 swing
- -2.0pp toward R · 2008: -49.3pp · 2024: -51.3pp
- All cycles
- 2024: R+51.3 2020: R+51.8 2016: R+56.0 2012: R+55.4 2008: R+49.3
Not yet ingested
- Civics
- —
Market trends
- HPI YoY
- ▼ -126.71%
- Current HPI
- 192.5562
- Rent YoY
- —
- Metro
- —
- State GDP YoY
- ▲ 0.68%
- F500 in state
- 2
Industry mix (Fortune 500 HQ in NE)
| Industry | F500 HQs | Revenue |
|---|---|---|
| Conglomerate | 1 | $371B |
|
||
Price history
+693.3% since first listed17 events — show timeline
- 2026-06-06 Pending — GPRMLS
- 2026-06-05 Listed $119,000 GPRMLS
- 2023-06-26 Sold (Public Records) $115,000 Public Records
- 2023-06-23 Listing Removed — GPRMLS
- 2023-06-23 Sold (MLS) $115,000 GPRMLS
- 2023-05-09 Pending — GPRMLS
- 2023-05-04 Price Changed $115,000 GPRMLS
- 2023-01-23 Price Changed $125,000 GPRMLS
- 2023-01-20 Relisted — GPRMLS
- 2023-01-20 Price Changed $134,900 GPRMLS
- 2023-01-16 Pending — GPRMLS
- 2022-09-07 Price Changed $139,900 GPRMLS
- 2022-08-19 Price Changed $149,000 GPRMLS
- 2022-07-28 Listed $155,000 GPRMLS
- 2021-10-22 Listing Removed — GPRMLS
- 2021-07-27 Listed $35,000 GPRMLS
- 2004-04-09 Sold (Public Records) $15,000 Public Records
Property tax history
+4.7%/yrLatest (2025): $817 · +116.3% YoY. Source: county tax records.
Cash-flow waterfall
monthlySold comps — $/sqft
last 12 mo · ≤1 miLoading sold comps…