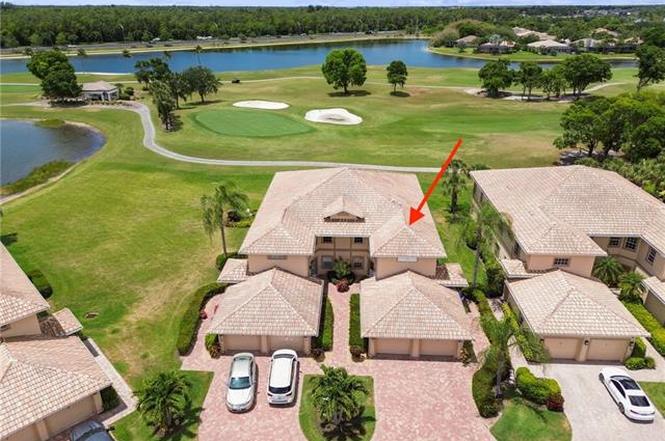
9165 Michael Cir #1002
Lely Resort, FL 34113
$419,000D+
3 bd · 2.0 ba ·
1,617 sqft ·
Built 1998
· Condo
· Active
· 3 DOM
Cashflow @ list (25.0% down · 7.5%)
Estimated rent
$4,455/mo
Mortgage (P&I)
−$2,197
Tax + insurance
−$1,125
HOA
−$541
Vac / Maint / Mgmt
−$936
Net cashflow
$-344/mo
Annual
$-4,124/yr
Cap rate
6.53%
Cash-on-cash
0.85%
DSCR
1.04
1% rule
1.06%
Cash to close
$117,320
Investor read
- This is a 3-bed/2.0-bath condo listed at $419k. Condition is rated good.
- At list price, monthly cash flow is $-344 ($-4k/yr) — negative.
- To cash-flow at today's rent, offer at most $369k (11.9% below list).
- Meets the 1% rule at list price ($4k rent vs $419k).
- Only 3 days on market — expect competitive offers; lowballing is unlikely to land.
- Recommended offer: $369k (11.9% below list) — sets the bar for cash-flow.
- Local home prices are declining (-3.0%/yr); year-one equity from $3k of loan paydown is wiped out by about $13k of value loss. Plan a longer hold.
- Location reads 61/100 on livability (#786 in FL) — a middle-class / working-renter tenant base. Strengths: crime A+, employment A-; Watch: health & safety D, schools F, amenities F.
- Collier (suburban): math 60% / reading 56% proficiency, ranked #16 of 73 in FL (top 22%) — acceptable for families but not a draw, mixed tenant base, ~2y average lease.
- Watch-outs: flood insurance adds $427/mo.
- Market conditions: Rents rising fast (+5.6%/yr); 597 active listings in the ZIP; 40 comparable units currently listed for rent nearby; rentals at typical pace (median 24d on market — plan ~3-4 weeks tenant-placement turnaround); solid renter incomes; 3,520 units permitted in Collier County in 2024 (959 in 5+ unit buildings).
- Collier County population projected at +30% by 2050 — long-run rental-demand tailwind backs the buy-and-hold thesis.
- Climate carrying-cost: in FEMA flood zone AE (mandatory federal flood insurance); severe wind risk, 99% chance of damaging wind over 30y; extreme-heat days projected 7→29/yr by 2055 (HVAC capex compounding) — expect insurance premiums to compound above CPI over the hold.
- At $4,455/mo this rent would consume 65% of the median local household income ($82k/yr) (locally 954% of renters already pay >50% of income on rent) — very limited rent-growth headroom before tenants either downsize or default.
Questions for listing agent
- What do current leases actually rent for vs. the listed asking? Can we see a recent rent roll and the last 12 months of T-12 income?
- What's the actual annual flood-insurance premium (NFIP or private), and is the property in a SFHA with mandatory coverage?
- What does the HOA fee cover, when was the last increase, and are there any pending special assessments or reserve-fund shortfalls?
- Any open or pending special assessments — roof, HVAC, plumbing, elevator, façade? What's the per-unit balance and payoff schedule, and is the seller paying it off at close or rolling it to the buyer?
- Is there a deadline driving the sale (1031 exchange, divorce, estate, relocation)? That informs how much negotiation room exists.
- Schools are F-rated, which usually means shorter tenancies and higher turnover. Who's the typical renter profile here, and what's been the actual vacancy rate?
- The area grade is low — what's the realistic commute time and amenity access for the typical tenant pool here? Any planned neighborhood developments (good or bad) we should know about?
- What's the average days-on-market for RENTAL listings here right now (not sales)? A rising rental-DOM trend means longer vacancies and softer asking-rent achievability than the comps imply.
CashFlowRE · CFR-F2J9GPBK98Z53C
· Data 2 days ago
cashflowre.app · 2026-05-29