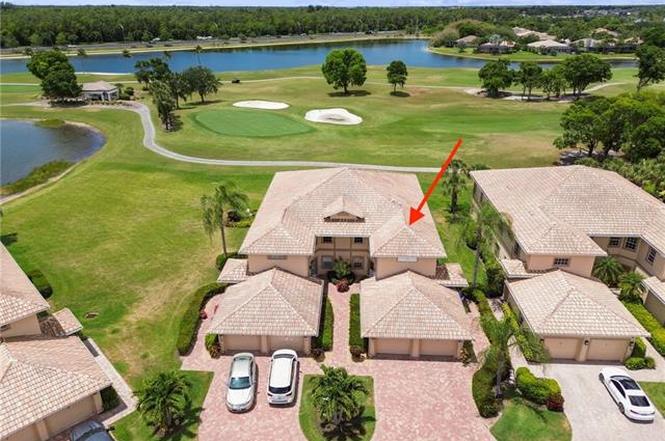
9165 Michael Cir #1002 · Lely Resort, FL
Flood risk 8/10 · Major
- FEMA flood zone
- AE
- Chance of flooding over 30 yrs
- 0.97%
- Est. flood insurance / yr
- $1,737 – $8,500
Fire risk 3/10 · Minor
- Est. fire insurance / yr
- $947 – $1,759
Heat risk 10/10 · Severe
- Hot days now (above 108°F)
- 7 days/yr
- Hot days in 30 yrs
- 29 days/yr
Wind risk 10/10 · Severe
- Chance of severe wind over 30 yrs
- 99.0%
Air-quality risk 2/10 · Minimal
- Unhealthy air days now
- 2 days/yr
- Unhealthy air days in 30 yrs
- 2 days/yr
Risk factors via First Street. Map © Google.
Why this score? — see what drove the D+ grade
The composite is a weighted blend of 9 inputs, each scored 0–100. Each bar is that input's sub-score; the figure is the points it added to the 100-point composite (weight × sub-score).
- Cash flow +14.4/30.0
- ARV discount +7.5/15.0
- 1% rule +5.6/10.0
- Schools +5.0/10.0
- DSCR +4.4/10.0
- Condition / age +4.0/5.0
- Rent growth +3.9/5.0
- Livability +3.1/5.0
- Appreciation +0.0/10.0
$419,000
🖨 Deal sheet 📄 Offer letter ✓ Due diligence
Listing remarks
Fully furnished and move-in ready, this rarely available 3-bedroom, 2-bath townhouse offers panoramic golf course and lake views, southwest exposure, low HOA fees, and the unique advantage that membership to the Players Club is not mandatory. Offering 1,617 square feet under air, this spacious second-floor residence enjoys stunning southwest exposure with sweeping views of the 13th green, fairways, and lakes of the semi-public Mustang Golf Course. Relax on the oversized screened lanai and enjoy spectacular sunsets, abundant natural light, and exceptional privacy with no resort traffic behind the building. Tastefully updated throughout, the home features a remodeled kitchen, renovated bathro
Key facts
- Lake views
- Renovated bathrooms
- Community pool
Tags
Property features AI
Finance
- Other: Part of a complex with 30 units (4 units in building; 2 units per floor; 2 floors)
- HOA & community: Mandatory HOA; Master HOA fee $100 annually; Condo fee $1,600 quarterly; Professional management; Maintenance covers insurance, irrigation water, lawn/land maintenance, legal/accounting, exterior pest control, street lights, and water; Community amenities include BBQ/picnic area, bike and jog path, community pool and spa/hot tub, dog park, and golf course; Non-gated community; Total annual recurring fees $6,500; total one-time fees $150
Exterior
- Parking: Attached 1-car garage
- Utilities: Central water; Central sewer; Cable available
- Home design: Residential attached villa (Carriage/Coach style); Built in 1998; Rear exposure faces southwest; Located in Lely Resort (AQUAMARINE AT SUNSTONE)
- Construction: Concrete block construction
- Exterior features: Tile roof; Double-hung windows; Exterior shutters; Stucco finish; Golf course and lake views; Central irrigation; Oversize lot; No RV allowed
Interior
- Kitchen: Electric cooktop; Dishwasher; Disposal; Microwave; Refrigerator/freezer; Refrigerator with icemaker
- Bedrooms: 3 bedrooms
- Flooring: Tile; Vinyl
- Bathrooms: 2 full bathrooms; Master bath with jetted tub and separate tub and shower
- Heating & cooling: Central electric heating; Central electric cooling
- Interior features: High-speed internet available; Vaulted ceiling; Walk-in closet; Breakfast bar and dining/living dining area; Screened balcony; Split-bedroom floor plan; Furnished
- Laundry & utility: Washer; Dryer
Neighborhood map
What this means for you Summary
Snapshot
- This is a 3-bed/2.0-bath condo listed at $419k. Condition is rated good.
Deal economics
- At list price, monthly cash flow is $-344 ($-4k/yr) — negative.
- To cash-flow at today's rent, offer at most $369k (11.9% below list).
- Meets the 1% rule at list price ($4k rent vs $419k).
- Recommended offer: $369k (11.9% below list) — sets the bar for cash-flow.
Location & tenants
- Location reads 61/100 on livability (#786 in FL) — a middle-class / working-renter tenant base. Strengths: crime A+, employment A-; Watch: health & safety D, schools F, amenities F.
- Collier (suburban): math 60% / reading 56% proficiency, ranked #16 of 73 in FL (top 22%) — acceptable for families but not a draw, mixed tenant base, ~2y average lease.
- Market conditions: Rents rising fast (+5.6%/yr); 597 active listings in the ZIP; 40 comparable units currently listed for rent nearby; rentals at typical pace (median 24d on market — plan ~3-4 weeks tenant-placement turnaround); solid renter incomes; 3,520 units permitted in Collier County in 2024 (959 in 5+ unit buildings).
- At $4,455/mo this rent would consume 65% of the median local household income ($82k/yr) (locally 954% of renters already pay >50% of income on rent) — very limited rent-growth headroom before tenants either downsize or default.
Forward outlook
- Local home prices are declining (-3.0%/yr); year-one equity from $3k of loan paydown is wiped out by about $13k of value loss. Plan a longer hold.
- Collier County population projected at +30% by 2050 — long-run rental-demand tailwind backs the buy-and-hold thesis.
Negotiation context
- Only 3 days on market — expect competitive offers; lowballing is unlikely to land.
Risks & watch-outs
- Watch-outs: flood insurance adds $427/mo.
- Climate carrying-cost: in FEMA flood zone AE (mandatory federal flood insurance); severe wind risk, 99% chance of damaging wind over 30y; extreme-heat days projected 7→29/yr by 2055 (HVAC capex compounding) — expect insurance premiums to compound above CPI over the hold.
Questions for the listing agent
- What do current leases actually rent for vs. the listed asking? Can we see a recent rent roll and the last 12 months of T-12 income?
- What's the actual annual flood-insurance premium (NFIP or private), and is the property in a SFHA with mandatory coverage?
- What does the HOA fee cover, when was the last increase, and are there any pending special assessments or reserve-fund shortfalls?
- Any open or pending special assessments — roof, HVAC, plumbing, elevator, façade? What's the per-unit balance and payoff schedule, and is the seller paying it off at close or rolling it to the buyer?
- Is there a deadline driving the sale (1031 exchange, divorce, estate, relocation)? That informs how much negotiation room exists.
- Schools are F-rated, which usually means shorter tenancies and higher turnover. Who's the typical renter profile here, and what's been the actual vacancy rate?
- The area grade is low — what's the realistic commute time and amenity access for the typical tenant pool here? Any planned neighborhood developments (good or bad) we should know about?
- What's the average days-on-market for RENTAL listings here right now (not sales)? A rising rental-DOM trend means longer vacancies and softer asking-rent achievability than the comps imply.
- What's the recent tenant-quality profile in this submarket — average credit score on applications, eviction rate, late-payment / NSF rate, and stable-employment percentage? A property-management company in the area should have these aggregated.
- How much new apartment / multifamily construction is in the pipeline within 1–3 miles? Heavy new supply (>2% of stock underway) typically softens rents 12–24 months out; light construction supports rent growth.
Investment metrics
- 1% rule
- 1.06% ✓
- Cap rate
- 6.53%
- Cash-on-cash
- 0.85%
- DSCR
- 1.04
- GRM
- 7.8
CMA / ARV
No comps found within radius.
Projected returns pro-forma
-3.0% appreciation · 5.59% rent growth · sell at horizon
- IRR
- -18.1%
- Equity multiple
- 0.34×
- Total profit
- $-77,215
- Equity at exit
- $62,474
- IRR
- -4.6%
- Equity multiple
- 0.65×
- Total profit
- $-41,200
- Equity at exit
- $36,227
Cash invested: $117,320 (down + closing). Projections, not guarantees.
Landlord ↔ Tenant lean methodology
- Overall (STATE)
- 87 Strongly Landlord-Friendly
- State Florida
- 87 Strongly Landlord-Friendly · R+3
- County
- — inherits STATE
- City
- — inherits STATE
ZIP-level market 34113
- Rents YoY
- 5.6%
- Active inventory
- 597
- Price-to-rent
- 7.8×
Monthly cashflow live
- Estimated rent
- $4,455 medium interval (Pro) →
- Mortgage (P&I)
- −$2,197
- Tax est. 1.5%
- −$524 /mo · $6,285/yr
- Insurance
- −$175
- Flood insurance flood zone
- −$427 /mo · $5,118/yr
- HOA
- −$541
- Vacancy / Maint / Mgmt
- −$936
- Net cashflow
- $-344
Break-even live
UW: 25.0% down · 7.5% · 30yr · 1.5% tax · 5.0% vac · 8.0% maint · 8.0% mgmt
Financing live
Cash to close
- Down payment
- $104,750
- Closing costs
- $12,570
- Reserves months
- —
- Total cash needed
- —
Loan-product check · same deal, 3 products live
Conventional
25% down · 7.5% · 30yr
- Down + closing
- —
- Monthly P&I
- —
- Monthly cashflow
- —
- DSCR
- —
- Eligible?
- —
Personal DTI + credit; lowest rate.
DSCR
20% down · 8.5% · 30yr
- Down + closing
- —
- Monthly P&I
- —
- Monthly cashflow
- —
- DSCR
- —
- Eligible?
- —
No personal income docs; deal must DSCR.
Hard money
10% down · 12.0% · 12mo
- Down + closing
- —
- Monthly P&I
- —
- Monthly cashflow
- —
- DSCR
- —
- Eligible?
- —
Short-term bridge; refi at stabilization.
Rent comps 40 comps
| Address | Beds | Baths | Sqft | Rent | $/sqft | DOM | Units | Dist |
|---|---|---|---|---|---|---|---|---|
| 9175 Michael Cir #4 Naples, FL | 3.0 | 2.0 | 1639 | $3,195 | $1.95 | 14d | 1 | 0.02mi |
| 9022 Michael Cir Unit 2-205 Naples, FL | 2.0 | 2.0 | 1450 | $3,500 | $2.41 | 23d | 1 | 0.10mi |
| 8540 Mystic Greens Way #305 Naples, FL | 2.0 | 2.0 | 1710 | $4,995 | $2.92 | 14d | 1 | 0.15mi |
| 8340 Mystic Greens Way #1501 Naples, FL | 2.0 | 2.0 | 1880 | $4,995 | $2.66 | 23d | 1 | 0.26mi |
| 8963 Appaloosa Ct Naples, FL | 4.0 | 2.0 | 2023 | $15,000 | $7.41 | 23d | 1 | 0.35mi |
| 8468 Indian Wells Way Naples, FL | 3.0 | 2.0 | 1704 | $10,500 | $6.16 | 23d | 1 | 0.38mi |
| 8432 Indian Wells Way Naples, FL | 3.0 | 2.0 | 1746 | $3,495 | $2.00 | 14d | 1 | 0.46mi |
| 8161 Twelve Oaks Cir #512 Naples, FL | 2.0 | 2.0 | 1066 | $5,000 | $4.69 | 23d | 1 | 0.49mi |
| 8888 Mustang Island Cir Naples, FL | 3.0 | 2.5 | 2028 | $10,000 | $4.93 | 23d | 1 | 0.50mi |
| 8884 Mustang Island Cir Naples, FL | 3.0 | 2.0 | 2000 | $12,500 | $6.25 | 21d | 1 | 0.51mi |
| 8036 Belmont Ct Unit 1073497P Naples, FL | 3.0 | 2.0 | 1840 | $5,316 | $2.89 | 23d | 1 | 0.62mi |
| 8967 Lely Island Cir Naples, FL | 3.0 | 2.0 | 2056 | $17,000 | $8.27 | 23d | 1 | 0.64mi |
| 7100 Falcons Glen Blvd Naples, FL | 3.0 | 2.0 | 1650 | $10,000 | $6.06 | 23d | 1 | 0.65mi |
| 7112 Falcons Glen Blvd Naples, FL | 3.0 | 2.0 | 1786 | $14,000 | $7.84 | 23d | 1 | 0.68mi |
| 9161 Chula Vista St Unit 135-2 Naples, FL | 4.0 | 3.0 | 1776 | $7,500 | $4.22 | 23d | 1 | 0.70mi |
| 9187 Celeste Dr Unit 1073494P Naples, FL | 2.0 | 2.0 | 1399 | $2,979 | $2.13 | 14d | 1 | 0.72mi |
| 9159 Delano St #9905 Naples, FL | 3.0 | 2.0 | 1770 | $4,995 | $2.82 | 23d | 1 | 0.79mi |
| 9155 Delano St Unit 1545913P Naples, FL | 3.0 | 2.0 | 1797 | $3,871 | $2.15 | 14d | 1 | 0.79mi |
| 9118 Chula Vista St #12002 Naples, FL | 2.0 | 2.5 | 1531 | $4,200 | $2.74 | 23d | 1 | 0.79mi |
| 9151 Delano St #9702 Naples, FL | 3.0 | 2.5 | 1733 | $2,650 | $1.53 | 14d | 1 | 0.80mi |
| 9102 Chula Vista St #11302 Naples, FL | 2.0 | 2.5 | 1531 | $2,695 | $1.76 | 21d | 1 | 0.81mi |
| 9092 Chula Vista St #11003 Naples, FL | 2.0 | 2.0 | 1404 | $6,850 | $4.88 | 23d | 1 | 0.82mi |
| 9088 Chula Vista St Unit 108-3 Naples, FL | 2.0 | 2.0 | 1404 | $5,700 | $4.06 | 23d | 1 | 0.82mi |
| 22 Cypress View Dr Unit B22 Naples, FL | 2.0 | 2.0 | 1534 | $7,000 | $4.56 | 23d | 1 | 0.85mi |
| 9115 Capistrano St S #8207 Naples, FL | 2.0 | 2.5 | 1494 | $6,000 | $4.02 | 23d | 1 | 0.86mi |
| 11496 Sumter Grove Cir Naples, FL | 1.0–2.0 | 1.0–2.0 | 1067 | $2,134 | $2.00 | 14d | 14 | 0.86mi |
| 9109 Yuba Ln Unit 80 Naples, FL | 3.0 | 2.5 | 1729 | $3,900 | $2.26 | 23d | 1 | 0.86mi |
| 6903 Mauna Loa Ln Naples, FL | 3.0 | 2.5 | 2224 | $13,500 | $6.07 | 23d | 1 | 0.87mi |
| 6737 Bent Grass Dr Naples, FL | 3.0 | 2.0 | 1745 | $12,000 | $6.88 | 23d | 1 | 0.88mi |
| 9111 Capistrano St S #8303 Naples, FL | 2.0 | 2.5 | 1432 | $7,500 | $5.24 | 23d | 1 | 0.88mi |
| 9076 Rialto St Unit 62 Naples, FL | 3.0 | 2.5 | 1624 | $7,500 | $4.62 | 23d | 1 | 0.89mi |
| 9072 Rialto St #6302 Naples, FL | 3.0 | 2.0 | 1771 | $8,250 | $4.66 | 21d | 1 | 0.91mi |
| 6590 Beach Resort Dr Unit 305 Naples, FL | 2.0 | 2.0 | 1351 | $4,500 | $3.33 | 14d | 1 | 0.91mi |
| 9102 Capistrano St S Unit 72-3 Naples, FL | 2.0 | 2.5 | 1520 | $6,500 | $4.28 | 23d | 1 | 0.91mi |
| 6753 Bent Grass Dr Naples, FL | 3.0 | 3.0 | 1945 | $8,000 | $4.11 | 23d | 1 | 0.92mi |
| 6757 Bent Grass Dr Naples, FL | 3.0 | 2.0 | 1719 | $3,650 | $2.12 | 23d | 1 | 0.93mi |
| 9073 Rialto St #6002 Naples, FL | 3.0 | 2.0 | 1771 | $7,500 | $4.23 | 23d | 1 | 0.94mi |
| 9081 Albion Ln S #6510 Naples, FL | 3.0 | 2.5 | 2004 | $6,280 | $3.13 | 14d | 1 | 0.95mi |
| 9081 Albion Ln S #6505 Naples, FL | 2.0 | 2.0 | 1225 | $7,500 | $6.12 | 23d | 1 | 0.95mi |
| 6769 Bent Grass Dr Naples, FL | 2.0 | 2.0 | 1719 | $10,500 | $6.11 | 23d | 1 | 0.95mi |
HOA detail condo
- Monthly dues
- $541 · $6,492/yr
- Assessments
- None detected in remarks — confirm with the listing agent.
Listing history 4 events
-
2026-06-18days on market $419,000 Active 3 DOM
-
2026-06-17days on market $419,000 Active 2 DOM
-
2026-06-15remarks 699-char remark
-
2026-06-15$419,000 Active 1 DOM
ⓘ Source: listings_history table (triggers on properties + properties_extension) + one-shot
backfill from property_details.listing_events for pre-trigger history.
Climate risk First Street
- Flood 8/10 Severe FEMA zone AE · 97% chance over 30 yrs
- Wildfire 3/10 Moderate
- Heat 10/10 Extreme 7 d/yr ≥108°F today · 29 d/yr by 30 yrs out
- Wind 10/10 Extreme 99% chance of damaging wind over 30 yrs
- Air quality 2/10 Low 2 unhealthy d/yr today · 2 by 30 yrs out
Nearby sold comps map
Loading sold comps map…
Walkable amenities ~0.75 mi
Loading nearby amenities…
Taxation est. · year 1
- Rental income
- $53,460
- − Mortgage interest
- −$23,471
- − Property taxes
- −$6,285
- − Insurance
- −$7,214
- − Repairs & maintenance
- −$4,277
- − Management
- −$4,277
- − HOA
- −$6,492
- − Depreciation
- −$12,189
- Taxable loss
- −$10,744
- Est. tax savings @ 24.0%
- +$2,578
- After-tax cash flow
- $-1,546/yr
For passive investors: Depreciation is non-cash, so a rental often shows a tax loss while cash-flowing — sheltering income. Rental losses are passive: they offset passive income freely, and up to $25,000/yr can offset ordinary (W-2) income if you actively participate and your MAGI is under $100k (phasing out to $0 by $150k); unused losses carry forward. On sale, claimed depreciation is recaptured at up to 25%, and gains may owe capital-gains tax (a 1031 exchange can defer both). Figures are a year-1 estimate at your 24.0% rate — not tax advice; consult a CPA.
Condition & rehab AI · 12 photos
This move-in ready townhouse offers stunning golf course and lake views with a well-maintained exterior and updated interior. Minor touch-ups and cleaning would further enhance its curb appeal and value.
Value-add opportunities
- Both Paint exterior trim — Enhances curb appeal and value
- Both Clean gutters — Improves drainage and aesthetics
Renovation cost estimate screening
Value-add ROI direction
- Both Paint exterior trim — Enhances curb appeal and value ↑
- Both Clean gutters — Improves drainage and aesthetics ↑
ⓘ Cost ranges are severity-bucket heuristics (US national rule-of-thumb). Get contractor quotes + a written scope before underwriting a rehab budget.
Schools (NCES district)
- District
- Collier
- NCES district ID
- 1200330
- Math proficiency
- 60% ▼ -4.00%
- Reading proficiency
- 56% ▼ -2.00%
- Median HH income
- $58,275
- Composite
- 50.23/100
- National rank
- #1892
- State rank
- #16 of 73 in FL
Livability — Lely Resort
- Score
- 61/100
- State rank
- #786
- US rank
- #17981
Category grades
Schools grade is shown separately in the Schools card above.
Census & demographics
- Census place
- Lely Resort, FL
- County
- Collier County · 396,295 people
- Metro
- Naples-Marco Island, FL
- Population (ZIP)
- 26,056
- Household income
- $81,674
- Rent vs Own
- Severe rent burden
- 954.0
Population outlook (Collier County) Hauer SSP2
- Today (2025)
- 420,858 people
- By 2030
- 450,054 · +6.9%
- By 2040
- 502,232 · +19.3%
- By 2050
- 544,932 · +29.5%
- By 2075
- 627,203 · +49.0%
- By 2100
- 659,015 · +56.6%
Race, ethnicity, and origin ACS 2023
- Neighborhood character
- Diverse neighborhood (Simpson 0.59)
- Race & ethnicity
- White 56% Hispanic / Latino 28% Black 12% Two or more races 11% Asian 2%
- Hispanic origin (detail)
- Mexican 17% Puerto Rican 3% Cuban 2%
- Common ancestry
- Hispanic 10% Romanian 3% Lithuanian 2%
- Foreign-born
- 26% · Canada, Jamaica, Vietnam
- Languages at home
- 63% English-only · Spanish 24% French/Haitian/Cajun 9% Other Indo-European 2%
Political lean MEDSL · Collier
- 2024 margin
- Solid R (+33.1) · D 33.1% · R 66.2%
- 2008→2024 swing
- -10.6pp toward R · 2008: -22.5pp · 2024: -33.1pp
- All cycles
- 2024: R+33.1 2020: R+24.7 2016: R+26.0 2012: R+30.1 2008: R+22.5
Not yet ingested
- Civics
- —
Market trends
- HPI YoY
- ▼ -194.86%
- Current HPI
- 279.4232
- Rent YoY
- ▲ 5.59%
- Metro
- Naples-Marco Island, FL
- State GDP YoY
- ▲ 3.28%
- F500 in state
- 36
Industry mix (Fortune 500 HQ in FL)
| Industry | F500 HQs | Revenue |
|---|---|---|
| Industrial Technology | 2 | $29B |
|
||
| Insurance | 2 | $17B |
|
||
| Retail | 1 | $60B |
|
||
| Technology Distribution | 1 | $58B |
|
||
| Homebuilding | 1 | $35B |
|
||
| Technology Manufacturing | 1 | $35B |
|
||
Price history
1 event — show timeline
- 2026-06-15 Listed $419,000 BEARMLS
Cash-flow waterfall
monthlySold comps — $/sqft
last 12 mo · ≤1 miLoading sold comps…