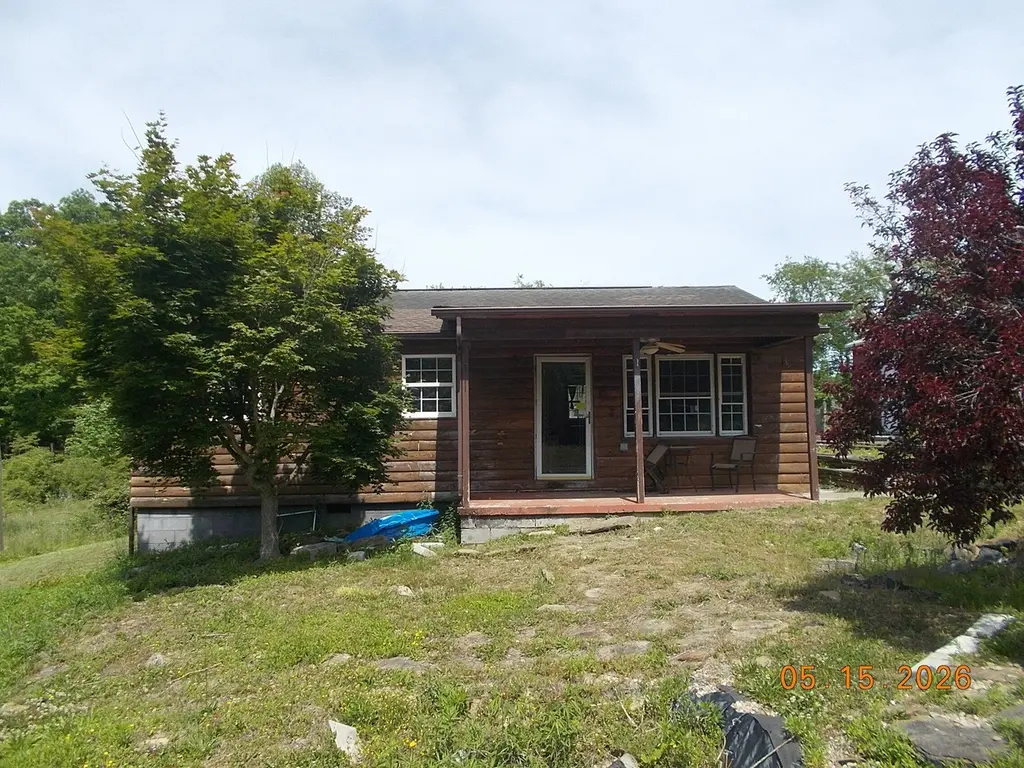
4054 Keavy Rd
London, KY 40744
$94,000C
3 bd · 1.0 ba ·
1,008 sqft ·
Built 1988
· SingleFamily
· Active
· 8 DOM
Cashflow @ list (25.0% down · 7.5%)
Estimated rent
$921/mo
Mortgage (P&I)
−$493
Tax + insurance
−$163
HOA
−$0
Vac / Maint / Mgmt
−$193
Net cashflow
$72/mo
Annual
$862/yr
Cap rate
7.92%
Cash-on-cash
5.81%
DSCR
1.26
1% rule
0.98%
Cash to close
$26,320
Investor read
- This is a 3-bed/1.0-bath single-family listed at $94k.
- At list price, monthly cash flow is $72 ($862/yr) — positive.
- The deal already cash-flows at list — no discount required.
- To meet the 1% rule (rent ≥ 1% of price), the offer needs to be $92k (2.0% below list).
- Only 8 days on market — expect competitive offers; lowballing is unlikely to land.
- Recommended offer: $92k (2.0% below list) — sets the bar for 1% rule.
- Local home prices are declining (-3.0%/yr); year-one equity from $650 of loan paydown is wiped out by about $3k of value loss. Plan a longer hold.
- Location reads 68/100 on livability (#202 in KY) — a middle-class / working-renter tenant base. Strengths: cost of living A+, housing A+, health & safety B+; Watch: employment D+, amenities F, commute F.
- Laurel County (town): math 51% / reading 56% proficiency, ranked #8 of 165 in KY (top 5%) — acceptable for families but not a draw, mixed tenant base, ~2y average lease.
- Zoned schools: Wyan-Pine Grove Elementary (math 52% / reading 47%, grade D, #100 of 676 statewide, top 16%, 424 students, 74% FRL); South Laurel Middle School (math 36% / reading 50%, grade D-, #43 of 217 statewide, top 21%, 979 students, 70% FRL); South Laurel High School (math 37% / reading 42%, grade F, #40 of 254 statewide, top 19%, 1,108 students, 66% FRL).
- Watch-outs: flood insurance adds $56/mo.
- Market conditions: 173 active listings in the ZIP; 16 units permitted in Laurel County in 2024 (0 in 5+ unit buildings).
- 2 sale attempts since 6y ago with the ask held roughly flat each time — persistent listings suggest the price (not the market) is what's stuck; bring a comps-based counter.
- Climate carrying-cost: severe flood risk; moderate wildfire risk — expect insurance premiums to compound above CPI over the hold.
- Cap rate 7.9% vs local median 2.2% in London — top-decile yield for the area; either an underpriced asset or a hidden risk that comps aren't pricing in. Stress-test before assuming the spread holds.
Questions for listing agent
- What's the actual annual flood-insurance premium (NFIP or private), and is the property in a SFHA with mandatory coverage?
- Is there a deadline driving the sale (1031 exchange, divorce, estate, relocation)? That informs how much negotiation room exists.
- Schools are D-rated, which usually means shorter tenancies and higher turnover. Who's the typical renter profile here, and what's been the actual vacancy rate?
- What's the average days-on-market for RENTAL listings here right now (not sales)? A rising rental-DOM trend means longer vacancies and softer asking-rent achievability than the comps imply.
- What's the recent tenant-quality profile in this submarket — average credit score on applications, eviction rate, late-payment / NSF rate, and stable-employment percentage? A property-management company in the area should have these aggregated.
- How much new for-sale + rental construction is in the pipeline within 1–3 miles? Heavy new supply typically softens prices + rents 12–24 months out; constrained supply supports both.
CashFlowRE · CFR-F4PD1X6DTEW7XE
· Data 2 days ago
cashflowre.app · 2026-05-29