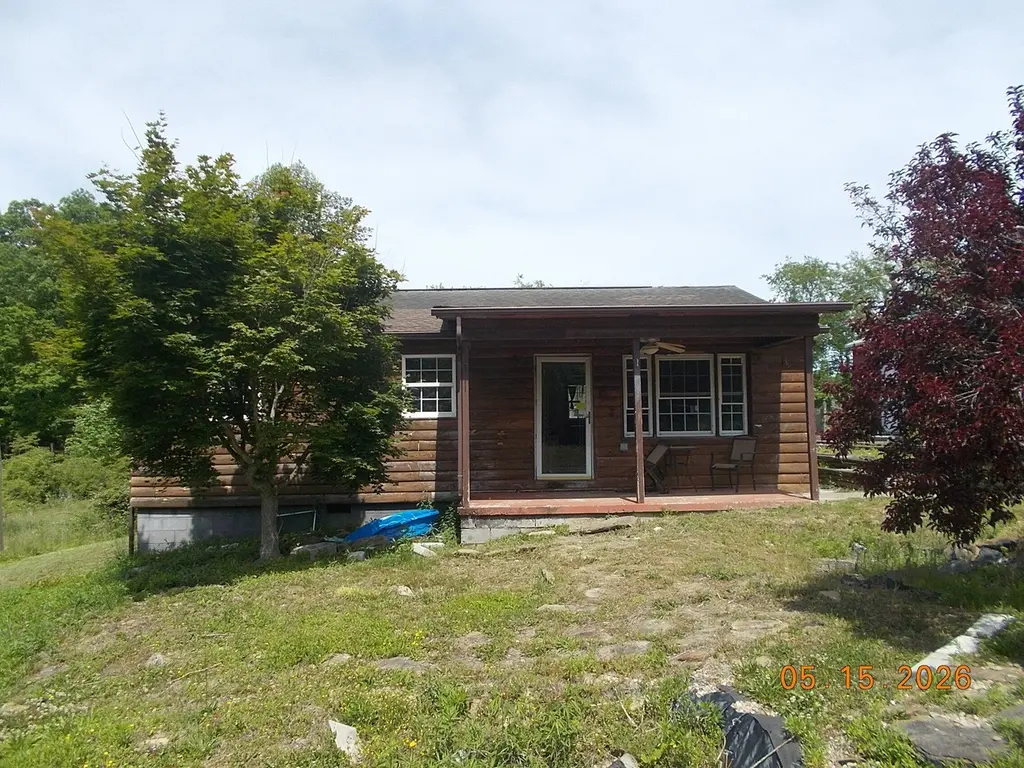
4054 Keavy Rd · London, KY
Flood risk 9/10 · Severe
- FEMA flood zone
- X (unshaded)
- Chance of flooding over 30 yrs
- 0.99%
- Est. flood insurance / yr
- $473 – $860
Fire risk 5/10 · Moderate
- Est. fire insurance / yr
- $839 – $1,559
Heat risk 4/10 · Minor
- Hot days now (above 101°F)
- 7 days/yr
- Hot days in 30 yrs
- 19 days/yr
Wind risk 3/10 · Minor
- Chance of severe wind over 30 yrs
- 5.0%
Air-quality risk 2/10 · Minimal
- Unhealthy air days now
- 0 days/yr
- Unhealthy air days in 30 yrs
- 1 days/yr
Risk factors via First Street. Map © Google.
Why this score? — see what drove the C grade
The composite is a weighted blend of 9 inputs, each scored 0–100. Each bar is that input's sub-score; the figure is the points it added to the 100-point composite (weight × sub-score).
- Cash flow +20.7/30.0
- ARV discount +15.0/15.0
- DSCR +6.6/10.0
- 1% rule +4.8/10.0
- Schools +4.4/10.0
- Livability +3.4/5.0
- Rent growth +2.5/5.0
- Condition / age +2.5/5.0
- Appreciation +0.0/10.0
$94,000
🖨 Deal sheet 📄 Offer letter ✓ Due diligence
Listing remarks MLS
Charming 3 bedroom 1 bath with the feel of the country yet close to town. Walking in you will notice the open living room and kitchen with updated appliances, wood cabinets, and natural light. Insulated garage. The huge back deck and pool makes for great entertainment and privacy on a large lot. Hurry before this one is gone too!
Key facts
- Log sided house
- Kitchen cabinets
- Pastoral view
Tags
Property features AI
Finance
- Other: Lot approximately 0.67 acres (public records); Approximately 1,084 building area total
Exterior
- Parking: Detached garage
- Utilities: Public water available; Septic tank sewer; Electricity available; Cable available
- Home design: House; One story
- Construction: Log siding construction; Block foundation; Shingle roof
- Exterior features: Shingle roof; Block foundation; Log siding
Interior
- Kitchen: Eat-in kitchen
- Bedrooms: 6 total rooms (bedrooms and other rooms included)
- Flooring: Vinyl flooring
- Bathrooms: 1 full bathroom
- Heating & cooling: Heat pump for heating; Heat pump for cooling
- Interior features: Eat-in kitchen; Crawl space basement
- Laundry & utility: Electric dryer hookup
Neighborhood map
What this means for you Summary
Snapshot
- This is a 3-bed/1.0-bath single-family listed at $94k.
Deal economics
- At list price, monthly cash flow is $72 ($862/yr) — positive.
- The deal already cash-flows at list — no discount required.
- To meet the 1% rule (rent ≥ 1% of price), the offer needs to be $92k (2.0% below list).
- Recommended offer: $92k (2.0% below list) — sets the bar for 1% rule.
- Cap rate 7.9% vs local median 2.2% in London — top-decile yield for the area; either an underpriced asset or a hidden risk that comps aren't pricing in. Stress-test before assuming the spread holds.
Location & tenants
- Location reads 68/100 on livability (#202 in KY) — a middle-class / working-renter tenant base. Strengths: cost of living A+, housing A+, health & safety B+; Watch: employment D+, amenities F, commute F.
- Laurel County (town): math 51% / reading 56% proficiency, ranked #8 of 165 in KY (top 5%) — acceptable for families but not a draw, mixed tenant base, ~2y average lease.
- Zoned schools: Wyan-Pine Grove Elementary (math 52% / reading 47%, grade D, #100 of 676 statewide, top 16%, 424 students, 74% FRL); South Laurel Middle School (math 36% / reading 50%, grade D-, #43 of 217 statewide, top 21%, 979 students, 70% FRL); South Laurel High School (math 37% / reading 42%, grade F, #40 of 254 statewide, top 19%, 1,108 students, 66% FRL).
- Market conditions: 173 active listings in the ZIP; 16 units permitted in Laurel County in 2024 (0 in 5+ unit buildings).
Forward outlook
- Local home prices are declining (-3.0%/yr); year-one equity from $650 of loan paydown is wiped out by about $3k of value loss. Plan a longer hold.
Negotiation context
- Only 8 days on market — expect competitive offers; lowballing is unlikely to land.
- 2 sale attempts since 6y ago with the ask held roughly flat each time — persistent listings suggest the price (not the market) is what's stuck; bring a comps-based counter.
Risks & watch-outs
- Watch-outs: flood insurance adds $56/mo.
- Climate carrying-cost: severe flood risk; moderate wildfire risk — expect insurance premiums to compound above CPI over the hold.
Questions for the listing agent
- What's the actual annual flood-insurance premium (NFIP or private), and is the property in a SFHA with mandatory coverage?
- Is there a deadline driving the sale (1031 exchange, divorce, estate, relocation)? That informs how much negotiation room exists.
- Schools are D-rated, which usually means shorter tenancies and higher turnover. Who's the typical renter profile here, and what's been the actual vacancy rate?
- What's the average days-on-market for RENTAL listings here right now (not sales)? A rising rental-DOM trend means longer vacancies and softer asking-rent achievability than the comps imply.
- What's the recent tenant-quality profile in this submarket — average credit score on applications, eviction rate, late-payment / NSF rate, and stable-employment percentage? A property-management company in the area should have these aggregated.
- How much new for-sale + rental construction is in the pipeline within 1–3 miles? Heavy new supply typically softens prices + rents 12–24 months out; constrained supply supports both.
Investment metrics
- 1% rule
- 0.98% ✗
- Cap rate
- 7.92%
- Cash-on-cash
- 5.81%
- DSCR
- 1.26
- GRM
- 8.5
CMA / ARV
- ARV (on-the-fly)
- $135,072
- Comps found
- 3
Show comp detail 3 sales within ~0.75 mi
| Address | Dist | Beds/Ba | Sqft | Sold | Price | $/sf | Match |
|---|---|---|---|---|---|---|---|
| 168 Taylor Bridge Rd | 0.20mi | 3/2.0 | 1,036 (+3%) | 12mo | $125,000 | $121 | 72 |
| 4052 Keavy Rd | 0.02mi | 3/1.5 | 1,149 (+14%) | 19mo | $154,000 | $134 | 58 |
| 14 Alder Ct | 0.45mi | 3/2.0 | 1,120 (+11%) | 8mo | $205,000 | $183 | 50 |
Match score weights: distance 35% · size 25% · config 20% · recency 20%. Top-matched comps best support the ARV.
Projected returns pro-forma
-3.0% appreciation · 3.0% rent growth · sell at horizon
- IRR
- -11.1%
- Equity multiple
- 0.60×
- Total profit
- $-10,641
- Equity at exit
- $14,016
- IRR
- -1.8%
- Equity multiple
- 0.87×
- Total profit
- $-3,304
- Equity at exit
- $8,127
Cash invested: $26,320 (down + closing). Projections, not guarantees.
Landlord ↔ Tenant lean methodology
- Overall (STATE)
- 83 Strongly Landlord-Friendly
- State Kentucky
- 83 Strongly Landlord-Friendly · R+16
- County
- — inherits STATE
- City
- — inherits STATE
ZIP-level market 40744
- Home prices YoY
- -13.0%
- Active inventory
- 173
- Price-to-rent
- 8.5×
Monthly cashflow live
- Estimated rent
- $921 medium interval (Pro) →
- Mortgage (P&I)
- −$493
- Tax from tax record
- −$68 /mo · $817/yr
- Insurance
- −$39
- Flood insurance flood zone
- −$56 /mo · $666/yr
- HOA
- −$0
- Vacancy / Maint / Mgmt
- −$193
- Net cashflow
- $72
Break-even live
UW: 25.0% down · 7.5% · 30yr · 1.5% tax · 5.0% vac · 8.0% maint · 8.0% mgmt
Financing live
Cash to close
- Down payment
- $23,500
- Closing costs
- $2,820
- Reserves months
- —
- Total cash needed
- —
Loan-product check · same deal, 3 products live
Conventional
25% down · 7.5% · 30yr
- Down + closing
- —
- Monthly P&I
- —
- Monthly cashflow
- —
- DSCR
- —
- Eligible?
- —
Personal DTI + credit; lowest rate.
DSCR
20% down · 8.5% · 30yr
- Down + closing
- —
- Monthly P&I
- —
- Monthly cashflow
- —
- DSCR
- —
- Eligible?
- —
No personal income docs; deal must DSCR.
Hard money
10% down · 12.0% · 12mo
- Down + closing
- —
- Monthly P&I
- —
- Monthly cashflow
- —
- DSCR
- —
- Eligible?
- —
Short-term bridge; refi at stabilization.
Listing history 7 events
-
2026-06-18days on market $94,000 Active 8 DOM
-
2026-06-17days on market $94,000 Active 7 DOM
-
2026-06-16days on market $94,000 Active 6 DOM
-
2026-06-15days on market $94,000 Active 5 DOM
-
2026-06-13days on market $94,000 Active 3 DOM
-
2026-06-12remarks 242-char remark
-
2026-06-12$94,000 Active 2 DOM
ⓘ Source: listings_history table (triggers on properties + properties_extension) + one-shot
backfill from property_details.listing_events for pre-trigger history.
Tax reassessment forecast KY · Resets to sale price
- Current annual tax
- $817 · $68/mo
- Projected year-2 tax
- $817 · $68/mo
- Expected delta
- $0/yr ($0/mo · 0.0%)
ⓘ Screening estimate from a state-policy table — verify with the county assessor before closing.
Climate risk First Street
- Flood 9/10 Extreme FEMA zone X (unshaded) · 99% chance over 30 yrs
- Wildfire 5/10 Major
- Heat 4/10 Moderate 7 d/yr ≥101°F today · 19 d/yr by 30 yrs out
- Wind 3/10 Moderate 5% chance of damaging wind over 30 yrs
- Air quality 2/10 Low 0 unhealthy d/yr today · 1 by 30 yrs out
Nearby sold comps map
Loading sold comps map…
Walkable amenities ~0.75 mi
Loading nearby amenities…
Taxation est. · year 1
- Rental income
- $11,051
- − Mortgage interest
- −$5,265
- − Property taxes
- −$817
- − Insurance
- −$1,136
- − Repairs & maintenance
- −$884
- − Management
- −$884
- − Depreciation
- −$2,735
- Taxable loss
- −$670
- Est. tax savings @ 24.0%
- +$161
- After-tax cash flow
- $1,023/yr
For passive investors: Depreciation is non-cash, so a rental often shows a tax loss while cash-flowing — sheltering income. Rental losses are passive: they offset passive income freely, and up to $25,000/yr can offset ordinary (W-2) income if you actively participate and your MAGI is under $100k (phasing out to $0 by $150k); unused losses carry forward. On sale, claimed depreciation is recaptured at up to 25%, and gains may owe capital-gains tax (a 1031 exchange can defer both). Figures are a year-1 estimate at your 24.0% rate — not tax advice; consult a CPA.
Schools (NCES district)
- District
- Laurel County
- NCES district ID
- 2103210
- Math proficiency
- 51% ▼ -9.00%
- Reading proficiency
- 56% ▼ -11.00%
- Median HH income
- $36,577
- Composite
- 44.39/100
- National rank
- #2814
- State rank
- #8 of 165 in KY
Livability — London
- Score
- 68/100
- State rank
- #202
- US rank
- #10028
Category grades
Schools grade is shown separately in the Schools card above.
Census & demographics
- Population (ZIP)
- 20,104
Population outlook (Laurel County) Hauer SSP2
- Today (2025)
- 62,602 people
- By 2030
- 63,310 · +1.1%
- By 2040
- 63,706 · +1.8%
- By 2050
- 62,705 · +0.2%
- By 2075
- 58,574 · -6.4%
- By 2100
- 50,888 · -18.7%
Race, ethnicity, and origin ACS 2023
- Neighborhood character
- Predominantly White (94%)
- Race & ethnicity
- White 94% Two or more races 4% Hispanic / Latino 1%
- Common ancestry
- Italian 2% Serbian 1% Romanian 1%
- Foreign-born
- 2% · China, Canada
- Languages at home
- 98% English-only · Chinese 1% Spanish 0%
Political lean MEDSL · Laurel
- 2024 margin
- Solid R (+69.9) · D 14.5% · R 84.3% · Other 1.2%
- 2008→2024 swing
- -11.9pp toward R · 2008: -58.0pp · 2024: -69.9pp
- All cycles
- 2024: R+69.9 2020: R+66.7 2016: R+69.1 2012: R+63.6 2008: R+58.0
Not yet ingested
- Civics
- —
Market trends
- HPI YoY
- ▼ -40.52%
- Current HPI
- 270.3876
- Rent YoY
- —
- Metro
- —
- State GDP YoY
- ▲ 1.81%
- F500 in state
- 4
Industry mix (Fortune 500 HQ in KY)
| Industry | F500 HQs | Revenue |
|---|---|---|
| Healthcare | 1 | $118B |
|
||
| Food / Beverage | 1 | $7B |
|
||
Price history
+469.7% since first listed8 events — show timeline
- 2026-06-10 Listed $94,000 ImagineMLS
- 2021-01-08 Sold (Public Records) $105,000 Public Records
- 2021-01-08 Sold (MLS) $105,000 ImagineMLS
- 2020-11-13 Pending — ImagineMLS
- 2020-11-09 Listed $105,000 ImagineMLS
- 2005-12-01 Sold (Public Records) $37,000 Public Records
- 2000-08-01 Sold (Public Records) $48,900 Public Records
- 1998-04-01 Sold (Public Records) $16,500 Public Records
Property tax history
+8.1%/yrLatest (2025): $817 · +0.9% YoY. Source: county tax records.
Cash-flow waterfall
monthlySold comps — $/sqft
last 12 mo · ≤1 miLoading sold comps…