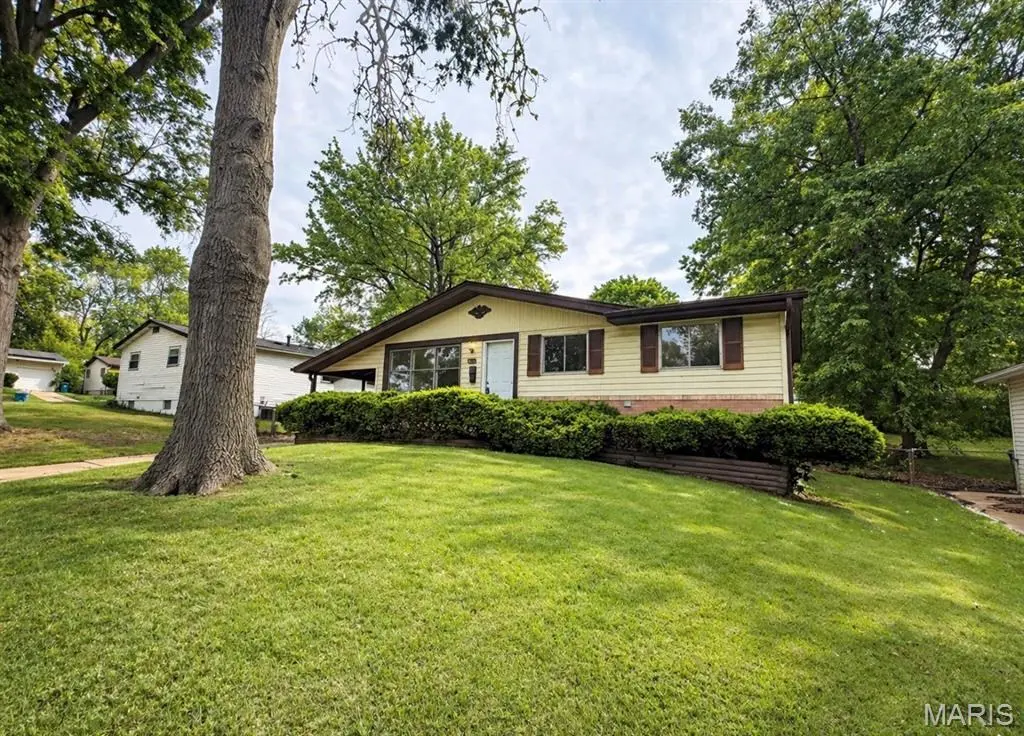
7018 Midwood Ave
Hazelwood, MO 63042
$129,900C+
3 bd · 1.0 ba ·
936 sqft ·
Built 1959
· SingleFamily
· Active
· 43 DOM
Cashflow @ list (25.0% down · 7.5%)
Estimated rent
$1,415/mo
Mortgage (P&I)
−$681
Tax + insurance
−$135
HOA
−$0
Vac / Maint / Mgmt
−$297
Net cashflow
$301/mo
Annual
$3,617/yr
Cap rate
9.08%
Cash-on-cash
9.95%
DSCR
1.44
1% rule
1.09%
Cash to close
$36,372
Investor read
- This is a 3-bed/1.0-bath single-family listed at $130k.
- At list price, monthly cash flow is $301 ($4k/yr) — positive.
- The deal already cash-flows at list — no discount required.
- Meets the 1% rule at list price ($1k rent vs $130k).
- It's been on market 43 days — a 3% lower offer ($126k) is reasonable based on typical stale-listing flexibility.
- Recommended offer: $126k (3.0% below list) — sets the bar for market timing.
- Local home prices are declining (-3.0%/yr); year-one equity from $898 of loan paydown is wiped out by about $4k of value loss. Plan a longer hold.
- Location reads 62/100 on livability (#395 in MO) — a middle-class / working-renter tenant base. Strengths: cost of living A+, housing A+; Watch: crime F, amenities F, commute F.
- Hazelwood (suburban): math 11% / reading 26% proficiency, ranked #306 of 324 in MO (top 94%) — low school quality limits family demand, transient renter base, plan for 1-2y turnover.
- Zoned schools: Armstrong Elem. (math 8% / reading 22%, grade F, #982 of 1,115 statewide, top 89%, 348 students, 83% FRL); Hazelwood West High (math 16% / reading 42%, grade F, #407 of 521 statewide, top 78%, 2,042 students, 54% FRL) — zoned schools average 69% FRL vs 53% district-wide (15 pts higher); higher-poverty schools than district average — tighter screening recommended.
- Watch-outs: built in 1959 — expect roof / HVAC / electrical / plumbing capex.
- Market conditions: Rents rising fast (+4.5%/yr); 68 active listings in the ZIP; 40 comparable units currently listed for rent nearby; rentals at typical pace (median 24d on market — plan ~3-4 weeks tenant-placement turnaround); 920 units permitted in St. Louis County in 2024 (250 in 5+ unit buildings).
- At projected returns (-3.0% appreciation + 4.5% rent growth), your $36k cash investment doubles in ~10 years — after that, you're playing with house money.
- Cap rate 9.1% vs local median 7.2% in Hazelwood — meaningfully above typical; check what's discounted (condition, days-on-market, listing class) to confirm the premium yield is real.
- This rent runs 34% of the median local income ($49k/yr) — at the standard rent-burdened threshold; future hikes will face affordability resistance.
Questions for listing agent
- It's been on market 43 days. Have you received any prior offers? Is the seller open to a 3% concession, seller financing, or rate buy-down credit?
- Built in 1959 — when were the roof, HVAC, electrical panel, plumbing, and water heater last replaced?
- Is there a deadline driving the sale (1031 exchange, divorce, estate, relocation)? That informs how much negotiation room exists.
- Schools are D-rated, which usually means shorter tenancies and higher turnover. Who's the typical renter profile here, and what's been the actual vacancy rate?
- Crime grade is F in this area — have there been break-ins, vandalism, or insurance claims at this property in the last 3 years? What carrier currently insures it and at what premium?
- What's the average days-on-market for RENTAL listings here right now (not sales)? A rising rental-DOM trend means longer vacancies and softer asking-rent achievability than the comps imply.
- What's the recent tenant-quality profile in this submarket — average credit score on applications, eviction rate, late-payment / NSF rate, and stable-employment percentage? A property-management company in the area should have these aggregated.
- How much new for-sale + rental construction is in the pipeline within 1–3 miles? Heavy new supply typically softens prices + rents 12–24 months out; constrained supply supports both.
CashFlowRE · CFR-F4WV1G5RMVB49T
· Data 2 days ago
cashflowre.app · 2026-05-29