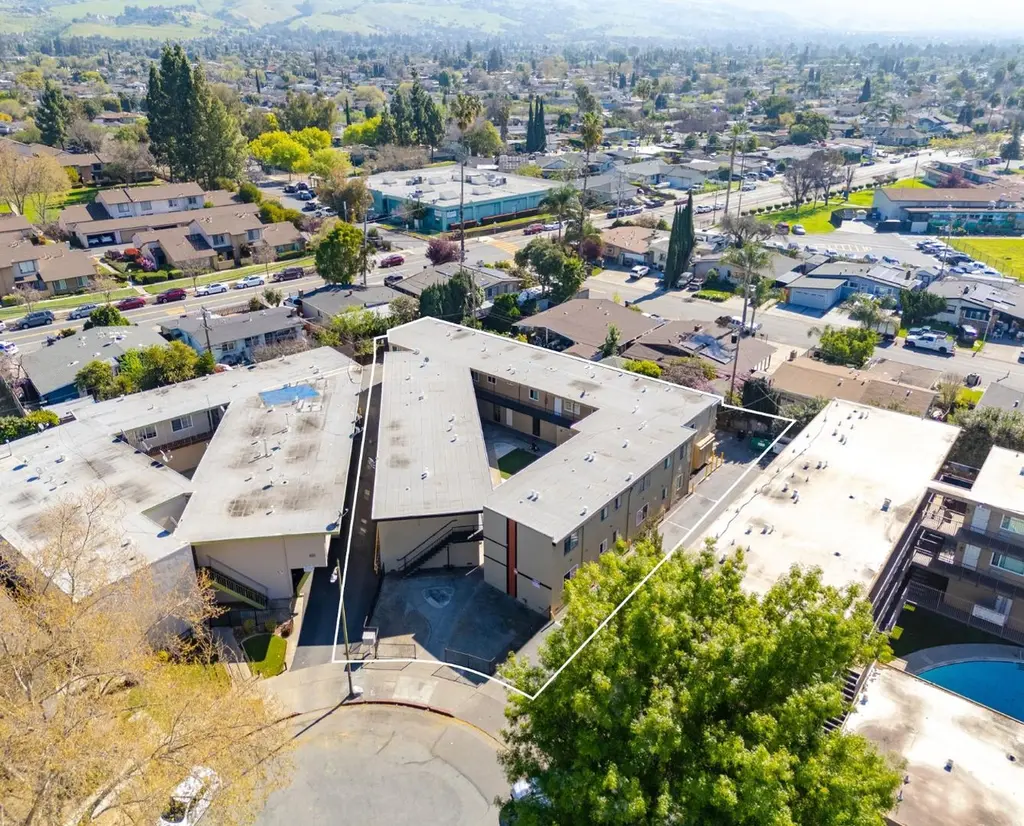
2748 Kollmar Dr
San Jose, CA 95127
$4,600,000D
400 bd · 256.0 ba ·
10,416 sqft ·
Built 1959
· MultiFamily
· Active
· 98 DOM
Cashflow @ list (25.0% down · 7.5%)
Estimated rent
$43,035/mo
Mortgage (P&I)
−$24,123
Tax + insurance
−$7,539
HOA
−$0
Vac / Maint / Mgmt
−$9,037
Net cashflow
$2,336/mo
Annual
$28,028/yr
Cap rate
6.90%
Cash-on-cash
2.18%
DSCR
1.10
1% rule
0.94%
Cash to close
$1,288,000
Investor read
- This is a 8×1bd/1ba + 8×2bd/1ba units multifamily listed at $4.60M.
- At list price, monthly cash flow is $2k ($28k/yr) — positive. Per door: $146/mo.
- The deal already cash-flows at list — no discount required.
- To meet the 1% rule (rent ≥ 1% of price), the offer needs to be $4.30M (6.4% below list).
- It's been on market 98 days — a 9% lower offer ($4.19M) is reasonable based on typical stale-listing flexibility.
- Recommended offer: $4.19M (9.0% below list) — sets the bar for market timing.
- Local home prices are declining (-3.0%/yr); year-one equity from $32k of loan paydown is wiped out by about $138k of value loss. Plan a longer hold.
- Location reads 78/100 on livability (#68 in CA, #2,559 nationally) — a middle-class / working-renter tenant base. Strengths: amenities A+, commute A+, employment A+; Watch: crime F, cost of living F.
- East Side Union High (urban): math 53% / reading 70% proficiency, ranked #69 of 517 in CA (top 13%) — acceptable for families but not a draw, mixed tenant base, ~2y average lease.
- Watch-outs: built in 1959 — expect roof / HVAC / electrical / plumbing capex.
- Market conditions: Rents rising (+1.1%/yr); 83 active listings in the ZIP; high-income renter base; 3,838 units permitted in Santa Clara County in 2024 (1,886 in 5+ unit buildings).
- Santa Clara County population projected at +24% by 2050 — long-run rental-demand tailwind backs the buy-and-hold thesis.
- 8 sale attempts since 28y ago with the ask held roughly flat each time — persistent listings suggest the price (not the market) is what's stuck; bring a comps-based counter.
- Climate carrying-cost: major flood risk; extreme-heat days projected 8→16/yr by 2055 (HVAC capex compounding) — expect insurance premiums to compound above CPI over the hold.
- Cap rate 6.9% vs local median 1.6% in San Jose — top-decile yield for the area; either an underpriced asset or a hidden risk that comps aren't pricing in. Stress-test before assuming the spread holds.
- At $43,035/mo this rent would consume 401% of the median local household income ($129k/yr) (locally 1238% of renters already pay >50% of income on rent) — very limited rent-growth headroom before tenants either downsize or default.
Questions for listing agent
- It's been on market 98 days. Have you received any prior offers? Is the seller open to a 9% concession, seller financing, or rate buy-down credit?
- Can we see the unit-by-unit rent roll, current vacancy, and any below-market leases? What's the average tenancy length?
- What capital expenditures (roof, boiler, parking lot, exteriors) have been made in the last 5 years, and what's planned in the next 2?
- Built in 1959 — when were the roof, HVAC, electrical panel, plumbing, and water heater last replaced?
- Why hasn't it sold? Are there any deal-killer items the seller is aware of (foundation, flood, title, zoning, code violations)?
- Is there a deadline driving the sale (1031 exchange, divorce, estate, relocation)? That informs how much negotiation room exists.
- Crime grade is F in this area — have there been break-ins, vandalism, or insurance claims at this property in the last 3 years? What carrier currently insures it and at what premium?
- The area grade is low — what's the realistic commute time and amenity access for the typical tenant pool here? Any planned neighborhood developments (good or bad) we should know about?
CashFlowRE · CFR-F56S5B869K4907
· Data 2 days ago
cashflowre.app · 2026-05-29