 16-Plex
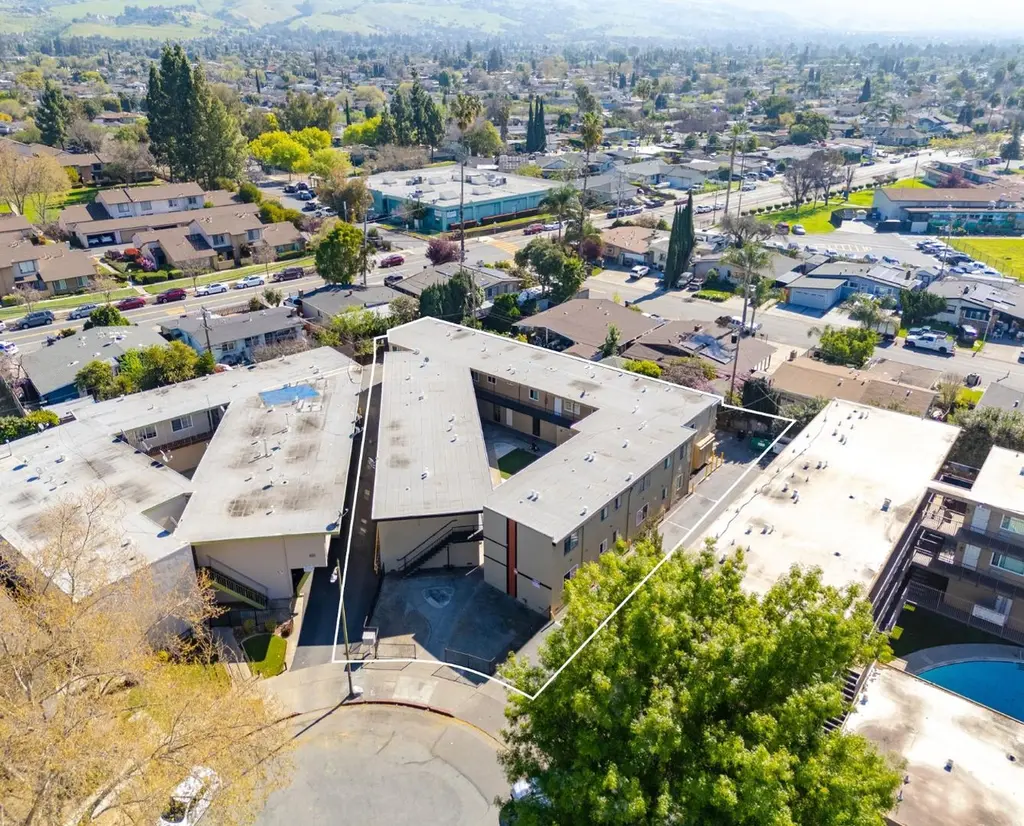
2748 Kollmar Dr · San Jose, CA
Flood risk 6/10 · Moderate
- FEMA flood zone
- X
- Chance of flooding over 30 yrs
- 0.71%
- Est. flood insurance / yr
- $507 – $1,088
Fire risk 1/10 · Minimal
- Est. fire insurance / yr
- $659 – $1,223
Heat risk 5/10 · Moderate
- Hot days now (above 94°F)
- 8 days/yr
- Hot days in 30 yrs
- 16 days/yr
Wind risk 1/10 · Minimal
- Chance of severe wind over 30 yrs
- —
Air-quality risk 10/10 · Severe
- Unhealthy air days now
- 22 days/yr
- Unhealthy air days in 30 yrs
- 23 days/yr
Risk factors via First Street. Map © Google.
Why this score? — see what drove the D grade
The composite is a weighted blend of 9 inputs, each scored 0–100. Each bar is that input's sub-score; the figure is the points it added to the 100-point composite (weight × sub-score).
- Cash flow +16.1/30.0
- Schools +5.5/10.0
- DSCR +5.0/10.0
- 1% rule +4.4/10.0
- Livability +3.9/5.0
- Rent growth +2.8/5.0
- Condition / age +2.5/5.0
- ARV discount +0.0/15.0
- Appreciation +0.0/10.0
$4,600,000
🖨 Deal sheet 📄 Offer letter ✓ Due diligence
Multi-family units
County records classify this as Multi-Family (5+ Unit). Listing-text estimate: 16 units. confirmed
5+ unit building — per-unit beds/baths from public records are typically unavailable; the breakdown below (if shown) is an estimate from the listing text.
Listing remarks MLS
The Zurich Group of Marcus & Millichap is please to present 2748 Kollmar Drive, a 16-unit apartment complex located in San Jose offering a rare high in-place yield opportunity in Silicon Valley. The property features a strong unit mix of one bedroom and two bedroom units, a layout that supports consistent tenant demand. The asset offers an attractive ~6.73% current cap rate with additional upside potential, allowing investors to benefit from strong in-place income with the opportunity to further increase cash flow through continued rental growth and operational improvements. The property also benefits from recent electrical upgrades including a new main panel and new subpanels installed in 2025. Ideally located one block from a new VTA Light Rail station currently under construction, the property benefits from excellent commuter access and close proximity to major Silicon Valley employment centers, supporting long-term rental demand.
Key facts
- Strong unit mix
- New main panel
- New subpanels
Tags
Neighborhood map
What this means for you Summary
Snapshot
- This is a 8×1bd/1ba + 8×2bd/1ba units multifamily listed at $4.60M.
Deal economics
- At list price, monthly cash flow is $2k ($28k/yr) — positive. Per door: $146/mo.
- The deal already cash-flows at list — no discount required.
- To meet the 1% rule (rent ≥ 1% of price), the offer needs to be $4.30M (6.4% below list).
- Recommended offer: $4.19M (9.0% below list) — sets the bar for market timing.
- Cap rate 6.9% vs local median 1.6% in San Jose — top-decile yield for the area; either an underpriced asset or a hidden risk that comps aren't pricing in. Stress-test before assuming the spread holds.
Location & tenants
- Location reads 78/100 on livability (#68 in CA, #2,559 nationally) — a middle-class / working-renter tenant base. Strengths: amenities A+, commute A+, employment A+; Watch: crime F, cost of living F.
- East Side Union High (urban): math 53% / reading 70% proficiency, ranked #69 of 517 in CA (top 13%) — acceptable for families but not a draw, mixed tenant base, ~2y average lease.
- Market conditions: Rents rising (+1.1%/yr); 83 active listings in the ZIP; high-income renter base; 3,838 units permitted in Santa Clara County in 2024 (1,886 in 5+ unit buildings).
- At $43,035/mo this rent would consume 401% of the median local household income ($129k/yr) (locally 1238% of renters already pay >50% of income on rent) — very limited rent-growth headroom before tenants either downsize or default.
Forward outlook
- Local home prices are declining (-3.0%/yr); year-one equity from $32k of loan paydown is wiped out by about $138k of value loss. Plan a longer hold.
- Santa Clara County population projected at +24% by 2050 — long-run rental-demand tailwind backs the buy-and-hold thesis.
Negotiation context
- It's been on market 98 days — a 9% lower offer ($4.19M) is reasonable based on typical stale-listing flexibility.
- 8 sale attempts since 28y ago with the ask held roughly flat each time — persistent listings suggest the price (not the market) is what's stuck; bring a comps-based counter.
Risks & watch-outs
- Watch-outs: built in 1959 — expect roof / HVAC / electrical / plumbing capex.
- Climate carrying-cost: major flood risk; extreme-heat days projected 8→16/yr by 2055 (HVAC capex compounding) — expect insurance premiums to compound above CPI over the hold.
Questions for the listing agent
- It's been on market 98 days. Have you received any prior offers? Is the seller open to a 9% concession, seller financing, or rate buy-down credit?
- Can we see the unit-by-unit rent roll, current vacancy, and any below-market leases? What's the average tenancy length?
- What capital expenditures (roof, boiler, parking lot, exteriors) have been made in the last 5 years, and what's planned in the next 2?
- Built in 1959 — when were the roof, HVAC, electrical panel, plumbing, and water heater last replaced?
- Why hasn't it sold? Are there any deal-killer items the seller is aware of (foundation, flood, title, zoning, code violations)?
- Is there a deadline driving the sale (1031 exchange, divorce, estate, relocation)? That informs how much negotiation room exists.
- Crime grade is F in this area — have there been break-ins, vandalism, or insurance claims at this property in the last 3 years? What carrier currently insures it and at what premium?
- The area grade is low — what's the realistic commute time and amenity access for the typical tenant pool here? Any planned neighborhood developments (good or bad) we should know about?
- What's the average days-on-market for RENTAL listings here right now (not sales)? A rising rental-DOM trend means longer vacancies and softer asking-rent achievability than the comps imply.
- What's the recent tenant-quality profile in this submarket — average credit score on applications, eviction rate, late-payment / NSF rate, and stable-employment percentage? A property-management company in the area should have these aggregated.
- How much new apartment / multifamily construction is in the pipeline within 1–3 miles? Heavy new supply (>2% of stock underway) typically softens rents 12–24 months out; light construction supports rent growth.
Investment metrics
- 1% rule
- 0.94% ✗
- Cap rate
- 6.90%
- Cash-on-cash
- 2.18%
- DSCR
- 1.10
- GRM
- 8.9
CMA / ARV
- ARV (median comp)
- $3,399,410
- List price
- $4,600,000
- Delta
- 35.32%
- Verdict
- OVERPRICED
- Comps
- 1 within 2.0 mi
Projected returns pro-forma
-3.0% appreciation · 1.14% rent growth · sell at horizon
- IRR
- -14.9%
- Equity multiple
- 0.48×
- Total profit
- $-675,141
- Equity at exit
- $685,875
- IRR
- -9.7%
- Equity multiple
- 0.45×
- Total profit
- $-706,609
- Equity at exit
- $397,724
Cash invested: $1,288,000 (down + closing). Projections, not guarantees.
Landlord ↔ Tenant lean methodology
- Overall (CITY)
- 0 Strongly Tenant-Friendly
- State California
- 18 Strongly Tenant-Friendly · D+13
- County
- — inherits STATE
- City San Jose
- 0 Strongly Tenant-Friendly · D+24
ZIP-level market 95127
- Rents YoY
- 1.1%
- Active inventory
- 83
- Price-to-rent
- 154.3×
Monthly cashflow live
- Estimated rent
- $43,035 medium interval (Pro) →
- Mortgage (P&I)
- −$24,123
- Tax from tax record
- −$5,622 /mo · $67,469/yr
- Insurance
- −$1,917
- HOA
- −$0
- Vacancy / Maint / Mgmt
- −$9,037
- Net cashflow
- $2,336
Break-even live
16-unit breakdown (identical units grouped — click to expand)
| Units | Beds | Baths | Est. rent |
|---|---|---|---|
| 8× units | 1 | 1 | $19,872 |
| #1 | 1 | 1 | $2,484 |
| #2 | 1 | 1 | $2,484 |
| #3 | 1 | 1 | $2,484 |
| #4 | 1 | 1 | $2,484 |
| #5 | 1 | 1 | $2,484 |
| #6 | 1 | 1 | $2,484 |
| #7 | 1 | 1 | $2,484 |
| #8 | 1 | 1 | $2,484 |
| 8× units | 2 | 1 | $23,160 |
| #9 | 2 | 1 | $2,895 |
| #10 | 2 | 1 | $2,895 |
| #11 | 2 | 1 | $2,895 |
| #12 | 2 | 1 | $2,895 |
| #13 | 2 | 1 | $2,895 |
| #14 | 2 | 1 | $2,895 |
| #15 | 2 | 1 | $2,895 |
| #16 | 2 | 1 | $2,895 |
| Total (16 units) | $43,035 | ||
UW: 25.0% down · 7.5% · 30yr · 1.5% tax · 5.0% vac · 8.0% maint · 8.0% mgmt
Financing live
Cash to close
- Down payment
- $1,150,000
- Closing costs
- $138,000
- Reserves months
- —
- Total cash needed
- —
Loan-product check · same deal, 3 products live
Conventional
25% down · 7.5% · 30yr
- Down + closing
- —
- Monthly P&I
- —
- Monthly cashflow
- —
- DSCR
- —
- Eligible?
- —
Personal DTI + credit; lowest rate.
DSCR
20% down · 8.5% · 30yr
- Down + closing
- —
- Monthly P&I
- —
- Monthly cashflow
- —
- DSCR
- —
- Eligible?
- —
No personal income docs; deal must DSCR.
Hard money
10% down · 12.0% · 12mo
- Down + closing
- —
- Monthly P&I
- —
- Monthly cashflow
- —
- DSCR
- —
- Eligible?
- —
Short-term bridge; refi at stabilization.
Listing history 37 events
-
2026-06-18days on market $4,600,000 Active 98 DOM
-
2026-06-17days on market $4,600,000 Active 97 DOM
-
2026-06-16days on market $4,600,000 Active 96 DOM
-
2026-06-15days on market $4,600,000 Active 95 DOM
-
2026-06-13days on market $4,600,000 Active 93 DOM
-
2026-06-13days on market $4,600,000 Active 92 DOM
-
2026-06-09days on market $4,600,000 Active 89 DOM
-
2026-06-08days on market $4,600,000 Active 88 DOM
-
2026-06-07days on market $4,600,000 Active 87 DOM
-
2026-06-05days on market $4,600,000 Active 84 DOM
-
2026-06-03days on market $4,600,000 Active 83 DOM
-
2026-06-02days on market $4,600,000 Active 82 DOM
-
2026-06-01days on market $4,600,000 Active 81 DOM
-
2026-05-31days on market $4,600,000 Active 80 DOM
-
2026-03-12$4,600,000 Active 951-char remark
Show marketing remark (951 chars)
The Zurich Group of Marcus & Millichap is please to present 2748 Kollmar Drive, a 16-unit apartment complex located in San Jose offering a rare high in-place yield opportunity in Silicon Valley. The property features a strong unit mix of one bedroom and two bedroom units, a layout that supports consistent tenant demand. The asset offers an attractive ~6.73% current cap rate with additional upside potential, allowing investors to benefit from strong in-place income with the opportunity to further increase cash flow through continued rental growth and operational improvements. The property also benefits from recent electrical upgrades including a new main panel and new subpanels installed in 2025. Ideally located one block from a new VTA Light Rail station currently under construction, the property benefits from excellent commuter access and close proximity to major Silicon Valley employment centers, supporting long-term rental demand.
-
2020-07-22soldstatus $4,275,000 85-char remark
Show marketing remark (85 chars)
Excellent cap rate with significant upside! Marketing package available upon request.
-
2020-07-22soldstatus $4,275,000 Sold 85-char remark
Show marketing remark (85 chars)
Excellent cap rate with significant upside! Marketing package available upon request.
-
2020-07-21soldstatus $4,275,000
-
2020-04-25status Pending (Do Not Show) 85-char remark
Show marketing remark (85 chars)
Excellent cap rate with significant upside! Marketing package available upon request.
-
2020-03-06$4,550,000 Active 85-char remark
Show marketing remark (85 chars)
Excellent cap rate with significant upside! Marketing package available upon request.
-
2020-03-06$4,550,000 85-char remark
Show marketing remark (85 chars)
Excellent cap rate with significant upside! Marketing package available upon request.
-
2010-09-09soldstatus $1,750,000
-
2006-06-02soldstatus $625,000
-
2002-04-04historical
-
2002-04-04soldstatus $1,700,000
-
2002-04-04soldstatus $1,700,000
-
2002-02-11soldstatus $1,700,000
-
2001-09-28$1,700,000
-
2001-09-28$1,700,000
-
1999-05-31soldstatus $1,250,000
-
1999-05-31soldstatus $1,250,000
-
1999-05-24soldstatus $1,250,000
-
1999-03-19historical
-
1998-07-16$1,249,000
-
1998-07-16$1,249,000
-
1997-09-30soldstatus $960,000
ⓘ Source: listings_history table (triggers on properties + properties_extension) + one-shot
backfill from property_details.listing_events for pre-trigger history.
Tax reassessment forecast CA · Resets to sale price
- Current annual tax
- $67,469 · $5,622/mo
- Projected year-2 tax
- $67,469 · $5,622/mo
- Expected delta
- $0/yr ($0/mo · 0.0%)
ⓘ Screening estimate from a state-policy table — verify with the county assessor before closing.
Climate risk First Street
- Flood 6/10 Major FEMA zone X · 71% chance over 30 yrs
- Wildfire 1/10 Low
- Heat 5/10 Major 8 d/yr ≥94°F today · 16 d/yr by 30 yrs out
- Wind 1/10 Low
- Air quality 10/10 Extreme 22 unhealthy d/yr today · 23 by 30 yrs out
Nearby sold comps map
Loading sold comps map…
Walkable amenities ~0.75 mi
Loading nearby amenities…
Taxation est. · year 1
- Rental income
- $516,420
- − Mortgage interest
- −$257,672
- − Property taxes
- −$67,469
- − Insurance
- −$23,000
- − Repairs & maintenance
- −$41,314
- − Management
- −$41,314
- − Depreciation
- −$133,818
- Taxable loss
- −$48,166
- Est. tax savings @ 24.0%
- +$11,560
- After-tax cash flow
- $39,588/yr
For passive investors: Depreciation is non-cash, so a rental often shows a tax loss while cash-flowing — sheltering income. Rental losses are passive: they offset passive income freely, and up to $25,000/yr can offset ordinary (W-2) income if you actively participate and your MAGI is under $100k (phasing out to $0 by $150k); unused losses carry forward. On sale, claimed depreciation is recaptured at up to 25%, and gains may owe capital-gains tax (a 1031 exchange can defer both). Figures are a year-1 estimate at your 24.0% rate — not tax advice; consult a CPA.
Schools (NCES district)
- District
- East Side Union High
- NCES district ID
- 0611820
- Math proficiency
- 53% ▲ 12.00%
- Reading proficiency
- 70% ▲ 8.00%
- Median HH income
- $80,293
- Composite
- 55.15/100
- National rank
- #1278
- State rank
- #69 of 517 in CA
Livability — San Jose
- Score
- 78/100
- State rank
- #68
- US rank
- #2559
Category grades
Schools grade is shown separately in the Schools card above.
Census & demographics
- Census place
- San Jose, CA
- County
- Santa Clara County · 1,806,974 people
- City population
- 954,479
- Metro
- San Jose-Sunnyvale-Santa Clara, CA
- Population (ZIP)
- 58,825
- Household income
- $128,786
- Rent vs Own
- Severe rent burden
- 1238.0
Population outlook (Santa Clara County) Hauer SSP2
- Today (2025)
- 2,179,074 people
- By 2030
- 2,301,297 · +5.6%
- By 2040
- 2,528,195 · +16.0%
- By 2050
- 2,712,135 · +24.5%
- By 2075
- 2,998,701 · +37.6%
- By 2100
- 2,931,429 · +34.5%
Race, ethnicity, and origin ACS 2023
- Neighborhood character
- Diverse neighborhood (Simpson 0.61)
- Race & ethnicity
- Hispanic / Latino 54% Asian 28% Two or more races 15% White 12% Black 2% Pacific Islander 1%
- Hispanic origin (detail)
- Mexican 50%
- Common ancestry
- Russian 2% Lithuanian 1% Iranian 1%
- Foreign-born
- 43% · Canada, Vietnam, China
- Languages at home
- 32% English-only · Spanish 43% Vietnamese 11% Chinese 3%
Political lean MEDSL · Santa Clara
- 2024 margin
- Solid D (+40.0) · D 68.1% · R 28.1% · Other 3.8%
- 2008→2024 swing
- -0.9pp no change · 2008: 40.9pp · 2024: 40.0pp
- All cycles
- 2024: D+40.0 2020: D+47.4 2016: D+52.5 2012: D+42.1 2008: D+40.9
Not yet ingested
- Civics
- —
Market trends
- HPI YoY
- ▼ -1242.13%
- Current HPI
- 296.1865
- Rent YoY
- ▲ 1.14%
- Metro
- San Jose-Sunnyvale-Santa Clara, CA
- State GDP YoY
- ▲ 3.21%
- F500 in state
- 116
Industry mix (Fortune 500 HQ in CA)
| Industry | F500 HQs | Revenue |
|---|---|---|
| Technology | 27 | $1,492B |
|
||
| Financial Services | 3 | $174B |
|
||
| Retail | 3 | $44B |
|
||
| Insurance | 3 | $26B |
|
||
| Media / Entertainment | 2 | $115B |
|
||
| Pharmaceuticals / Biotech | 2 | $62B |
|
||
Price history
+379.2% since first listed23 events — show timeline
- 2026-03-12 Listed $4,600,000 MLSListings
- 2026-03-12 Listed $4,600,000 bridgeMLS, Bay East AOR, or Contra Costa AOR
- 2020-07-22 Sold (MLS) $4,275,000 MLSListings
- 2020-07-22 Sold (MLS) $4,275,000 bridgeMLS, Bay East AOR, or Contra Costa AOR
- 2020-07-21 Sold (Public Records) $4,275,000 Public Records
- 2020-04-25 Pending — MLSListings
- 2020-03-06 Listed $4,550,000 MLSListings
- 2020-03-06 Listed $4,550,000 bridgeMLS, Bay East AOR, or Contra Costa AOR
- 2010-09-09 Sold (Public Records) $1,750,000 Public Records
- 2006-06-02 Sold (Public Records) $625,000 Public Records
- 2002-04-04 Sold (Public Records) $1,700,000 Public Records
- 2002-04-04 Sold (MLS) $1,700,000 bridgeMLS, Bay East AOR, or Contra Costa AOR
- 2002-04-04 Listing Removed — MLSListings
- 2002-02-11 Sold (MLS) $1,700,000 MLSListings
- 2001-09-28 Listed $1,700,000 bridgeMLS, Bay East AOR, or Contra Costa AOR
- 2001-09-28 Listed $1,700,000 MLSListings
- 1999-05-31 Sold (MLS) $1,250,000 MLSListings
- 1999-05-31 Sold (MLS) $1,250,000 bridgeMLS, Bay East AOR, or Contra Costa AOR
- 1999-05-24 Sold (Public Records) $1,250,000 Public Records
- 1999-03-19 Listing Removed — MLSListings
- 1998-07-16 Listed $1,249,000 MLSListings
- 1998-07-16 Listed $1,249,000 bridgeMLS, Bay East AOR, or Contra Costa AOR
- 1997-09-30 Sold (Public Records) $960,000 Public Records
Property tax history
+5.5%/yrLatest (2025): $67,469 · +1.8% YoY. Source: county tax records.
Cash-flow waterfall
monthlySold comps — $/sqft
last 12 mo · ≤1 miLoading sold comps…