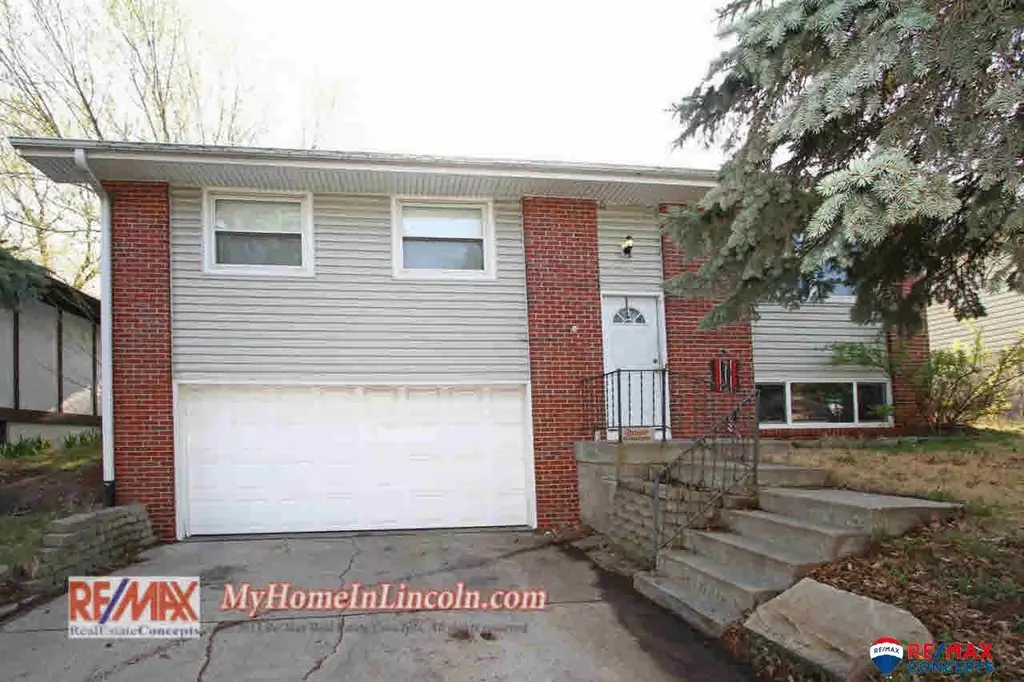
3720 S 56th St
Lincoln, NE 68506
$150,000C
3 bd · 1.5 ba ·
1,490 sqft ·
Built 1975
· SingleFamily
· Pending
Cashflow @ list (25.0% down · 7.5%)
Estimated rent
$1,528/mo
Mortgage (P&I)
−$787
Tax + insurance
−$312
HOA
−$0
Vac / Maint / Mgmt
−$321
Net cashflow
$109/mo
Annual
$1,304/yr
Cap rate
7.16%
Cash-on-cash
3.11%
DSCR
1.14
1% rule
1.02%
Cash to close
$42,000
Investor read
- This is a 3-bed/1.5-bath single-family listed at $150k.
- At list price, monthly cash flow is $109 ($1k/yr) — positive.
- The deal already cash-flows at list — no discount required.
- Meets the 1% rule at list price ($2k rent vs $150k).
- Only 0 days on market — expect competitive offers; lowballing is unlikely to land.
- Local home prices are declining (-3.0%/yr); year-one equity from $1k of loan paydown is wiped out by about $4k of value loss. Plan a longer hold.
- Location reads 85/100 on livability (#5 in NE, #545 nationally) — a professional / high-income tenant draw. Strengths: amenities A+, cost of living A+, housing A+; Watch: crime D+.
- Lincoln Public Schools (urban): math 50% / reading 53% proficiency, ranked #59 of 111 in NE (top 53%) — acceptable for families but not a draw, mixed tenant base, ~2y average lease.
- Zoned schools: Holmes Elementary School (math 47% / reading 62%, grade C, #161 of 502 statewide, top 38%, 409 students, 56% FRL); Pound Middle School (math 60% / reading 59%, grade B, #18 of 128 statewide, top 15%, 727 students, 39% FRL); Lincoln Southeast High School (math 51% / reading 52%, grade D+, #105 of 261 statewide, top 40%, 1,929 students, 16% FRL) — zoned schools at 37% FRL track the district average.
- Market conditions: Rents rising (+3.7%/yr); 151 active listings in the ZIP; 8 comparable units currently listed for rent nearby; rentals at typical pace (median 22d on market — plan ~3-4 weeks tenant-placement turnaround); 1,940 units permitted in Lancaster County in 2024 (895 in 5+ unit buildings).
- Lancaster County population projected at +37% by 2050 — long-run rental-demand tailwind backs the buy-and-hold thesis.
- 2 sale attempts since 9y ago with the ask held roughly flat each time — persistent listings suggest the price (not the market) is what's stuck; bring a comps-based counter.
- Cap rate 7.2% vs local median 3.0% in Lincoln — top-decile yield for the area; either an underpriced asset or a hidden risk that comps aren't pricing in. Stress-test before assuming the spread holds.
Questions for listing agent
- Built in 1975 — when were the roof, HVAC, electrical panel, plumbing, and water heater last replaced?
- Is there a deadline driving the sale (1031 exchange, divorce, estate, relocation)? That informs how much negotiation room exists.
- Schools are A-rated — typically a magnet for longer-tenancy family renters. What's the average tenant stay here, and is there a school-zone premium baked into asking?
- Crime grade is D in this area — have there been break-ins, vandalism, or insurance claims at this property in the last 3 years? What carrier currently insures it and at what premium?
- What's the average days-on-market for RENTAL listings here right now (not sales)? A rising rental-DOM trend means longer vacancies and softer asking-rent achievability than the comps imply.
- What's the recent tenant-quality profile in this submarket — average credit score on applications, eviction rate, late-payment / NSF rate, and stable-employment percentage? A property-management company in the area should have these aggregated.
- How much new for-sale + rental construction is in the pipeline within 1–3 miles? Heavy new supply typically softens prices + rents 12–24 months out; constrained supply supports both.
CashFlowRE · CFR-F5PB9AAFA1YWDR
· Data 1 week ago
cashflowre.app · 2026-05-29