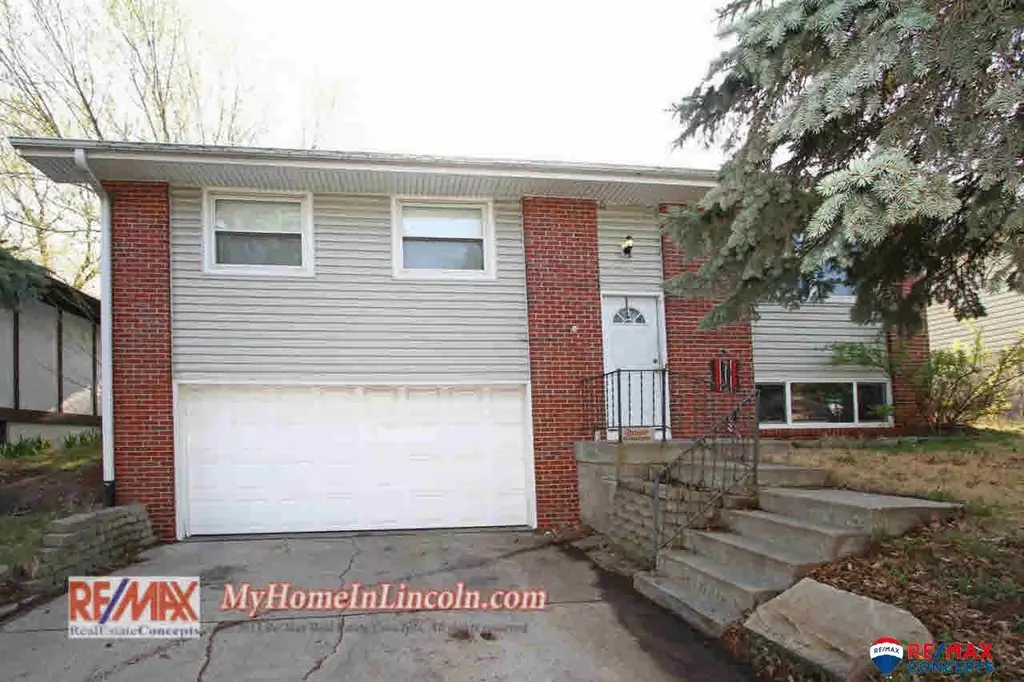
3720 S 56th St · Lincoln, NE
Flood risk 1/10 · Minimal
- FEMA flood zone
- X (unshaded)
- Chance of flooding over 30 yrs
- 0.0%
- Est. flood insurance / yr
- $473 – $860
Fire risk 1/10 · Minimal
- Est. fire insurance / yr
- $1,161 – $2,155
Heat risk 3/10 · Minor
- Hot days now (above 104°F)
- 7 days/yr
- Hot days in 30 yrs
- 16 days/yr
Wind risk 2/10 · Minimal
- Chance of severe wind over 30 yrs
- —
Air-quality risk 1/10 · Minimal
- Unhealthy air days now
- 0 days/yr
- Unhealthy air days in 30 yrs
- 0 days/yr
Risk factors via First Street. Map © Google.
Why this score? — see what drove the C grade
The composite is a weighted blend of 9 inputs, each scored 0–100. Each bar is that input's sub-score; the figure is the points it added to the 100-point composite (weight × sub-score).
- Cash flow +17.3/30.0
- ARV discount +15.0/15.0
- DSCR +5.4/10.0
- 1% rule +5.2/10.0
- Schools +4.4/10.0
- Livability +4.2/5.0
- Rent growth +3.4/5.0
- Condition / age +2.5/5.0
- Appreciation +0.0/10.0
$150,000
🖨 Deal sheet 📄 Offer letter ✓ Due diligence
Listing remarks MLS
There is SO MUCH to love about this beautifully updated 3-bedroom home in south Lincoln! There have been many updates over recent years, including newer windows, roof shingles (2011), HVAC (2007), as well as newer flooring and interior paint throughout the home. The bathrooms and kitchen also have been tastefully updated. Some other great features are the huge fenced backyard, maintenance-free brick and vinyl siding and the spacious daylight basement. The wonderful thing about being on an arterial street is that you never have to be worried about getting snowed in! Please call today to set up your private showing!
Key facts
- 6,534 sq ft lot
- 2 garage spots
- Built 1975
Neighborhood map
What this means for you Summary
Snapshot
- This is a 3-bed/1.5-bath single-family listed at $150k.
Deal economics
- At list price, monthly cash flow is $109 ($1k/yr) — positive.
- The deal already cash-flows at list — no discount required.
- Meets the 1% rule at list price ($2k rent vs $150k).
- Cap rate 7.2% vs local median 3.0% in Lincoln — top-decile yield for the area; either an underpriced asset or a hidden risk that comps aren't pricing in. Stress-test before assuming the spread holds.
Location & tenants
- Location reads 85/100 on livability (#5 in NE, #545 nationally) — a professional / high-income tenant draw. Strengths: amenities A+, cost of living A+, housing A+; Watch: crime D+.
- Lincoln Public Schools (urban): math 50% / reading 53% proficiency, ranked #59 of 111 in NE (top 53%) — acceptable for families but not a draw, mixed tenant base, ~2y average lease.
- Zoned schools: Holmes Elementary School (math 47% / reading 62%, grade C, #161 of 502 statewide, top 38%, 409 students, 56% FRL); Pound Middle School (math 60% / reading 59%, grade B, #18 of 128 statewide, top 15%, 727 students, 39% FRL); Lincoln Southeast High School (math 51% / reading 52%, grade D+, #105 of 261 statewide, top 40%, 1,929 students, 16% FRL) — zoned schools at 37% FRL track the district average.
- Market conditions: Rents rising (+3.7%/yr); 151 active listings in the ZIP; 8 comparable units currently listed for rent nearby; rentals at typical pace (median 21d on market — plan ~3-4 weeks tenant-placement turnaround); 1,940 units permitted in Lancaster County in 2024 (895 in 5+ unit buildings).
Forward outlook
- Local home prices are declining (-3.0%/yr); year-one equity from $1k of loan paydown is wiped out by about $4k of value loss. Plan a longer hold.
- Lancaster County population projected at +37% by 2050 — long-run rental-demand tailwind backs the buy-and-hold thesis.
Negotiation context
- Only 0 days on market — expect competitive offers; lowballing is unlikely to land.
- 2 sale attempts since 9y ago with the ask held roughly flat each time — persistent listings suggest the price (not the market) is what's stuck; bring a comps-based counter.
Questions for the listing agent
- Built in 1975 — when were the roof, HVAC, electrical panel, plumbing, and water heater last replaced?
- Is there a deadline driving the sale (1031 exchange, divorce, estate, relocation)? That informs how much negotiation room exists.
- Schools are A-rated — typically a magnet for longer-tenancy family renters. What's the average tenant stay here, and is there a school-zone premium baked into asking?
- Crime grade is D in this area — have there been break-ins, vandalism, or insurance claims at this property in the last 3 years? What carrier currently insures it and at what premium?
- What's the average days-on-market for RENTAL listings here right now (not sales)? A rising rental-DOM trend means longer vacancies and softer asking-rent achievability than the comps imply.
- What's the recent tenant-quality profile in this submarket — average credit score on applications, eviction rate, late-payment / NSF rate, and stable-employment percentage? A property-management company in the area should have these aggregated.
- How much new for-sale + rental construction is in the pipeline within 1–3 miles? Heavy new supply typically softens prices + rents 12–24 months out; constrained supply supports both.
Investment metrics
- 1% rule
- 1.02% ✓
- Cap rate
- 7.16%
- Cash-on-cash
- 3.11%
- DSCR
- 1.14
- GRM
- 8.2
CMA / ARV
- ARV (on-the-fly)
- $245,850
- Comps found
- 12
Show comp detail 12 sales within ~0.75 mi
| Address | Dist | Beds/Ba | Sqft | Sold | Price | $/sf | Match |
|---|---|---|---|---|---|---|---|
| 3720 S 56th St | 0.00mi | 3/1.5 | 1,490 (0%) | 0mo | $150,000 | $101 | 100 |
| 5415 Bancroft Ave | 0.08mi | 3/2.0 | 1,427 (-4%) | 2mo | $300,000 | $210 | 86 |
| 3804 S 56th St | 0.07mi | 3/2.0 | 1,428 (-4%) | 3mo | $265,000 | $186 | 85 |
| 3720 S 54 St | 0.09mi | 2/2.0 (-1) | 1,514 (+2%) | 6mo | $200,000 | $132 | 81 |
| 5401 Pioneers Blvd | 0.41mi | 2/2.0 (-1) | 1,420 (-5%) | 3mo | $145,000 | $102 | 64 |
| 4534 S 54th St | 0.56mi | 3/1.0 | 1,452 (-3%) | 5mo | $216,900 | $149 | 63 |
| 5410 Covey Ct | 0.69mi | 3/2.5 | 1,470 (-1%) | 2mo | $300,000 | $204 | 60 |
| 2645 S 55th St | 0.70mi | 2/1.5 (-1) | 1,545 (+4%) | 1mo | $265,000 | $172 | 56 |
| 4906 Calvert St | 0.46mi | 2/1.5 (-1) | 1,328 (-11%) | 3mo | $210,000 | $158 | 53 |
| 4730 Hillside St | 0.59mi | 3/1.5 | 1,330 (-11%) | 3mo | $185,000 | $139 | 52 |
| 5030 Spruce St | 0.65mi | 3/2.0 | 1,618 (+9%) | 6mo | $267,000 | $165 | 48 |
| 4821 S 57th St | 0.72mi | 3/2.0 | 1,640 (+10%) | 1mo | $290,000 | $177 | 47 |
Match score weights: distance 35% · size 25% · config 20% · recency 20%. Top-matched comps best support the ARV.
Projected returns pro-forma
-3.0% appreciation · 3.67% rent growth · sell at horizon
- IRR
- -10.6%
- Equity multiple
- 0.61×
- Total profit
- $-16,286
- Equity at exit
- $22,365
- IRR
- -0.2%
- Equity multiple
- 0.98×
- Total profit
- $-706
- Equity at exit
- $12,969
Cash invested: $42,000 (down + closing). Projections, not guarantees.
Landlord ↔ Tenant lean methodology
- Overall (STATE)
- 83 Strongly Landlord-Friendly
- State Nebraska
- 83 Strongly Landlord-Friendly · R+13
- County
- — inherits STATE
- City
- — inherits STATE
ZIP-level market 68506
- Rents YoY
- 3.7%
- Active inventory
- 151
- Price-to-rent
- 8.2×
Monthly cashflow live
- Estimated rent
- $1,528 high interval (Pro) →
- Mortgage (P&I)
- −$787
- Tax from tax record
- −$249 /mo · $2,991/yr
- Insurance
- −$62
- HOA
- −$0
- Vacancy / Maint / Mgmt
- −$321
- Net cashflow
- $109
Break-even live
UW: 25.0% down · 7.5% · 30yr · 1.5% tax · 5.0% vac · 8.0% maint · 8.0% mgmt
Financing live
Cash to close
- Down payment
- $37,500
- Closing costs
- $4,500
- Reserves months
- —
- Total cash needed
- —
Loan-product check · same deal, 3 products live
Conventional
25% down · 7.5% · 30yr
- Down + closing
- —
- Monthly P&I
- —
- Monthly cashflow
- —
- DSCR
- —
- Eligible?
- —
Personal DTI + credit; lowest rate.
DSCR
20% down · 8.5% · 30yr
- Down + closing
- —
- Monthly P&I
- —
- Monthly cashflow
- —
- DSCR
- —
- Eligible?
- —
No personal income docs; deal must DSCR.
Hard money
10% down · 12.0% · 12mo
- Down + closing
- —
- Monthly P&I
- —
- Monthly cashflow
- —
- DSCR
- —
- Eligible?
- —
Short-term bridge; refi at stabilization.
Rent comps 8 comps
| Address | Beds | Baths | Sqft | Rent | $/sqft | DOM | Units | Dist |
|---|---|---|---|---|---|---|---|---|
| 5218 High St Lincoln, NE | 4.0 | 1.5 | 1769 | $1,899 | $1.07 | 43d | 1 | 0.49mi |
| 3831 S 46th St Unit 1 Lincoln, NE | 2.0 | 1.5 | 958 | $995 | $1.04 | 43d | 1 | 0.69mi |
| 3831 S 46th St Unit 11 Lincoln, NE | 2.0 | 1.5 | 958 | $995 | $1.04 | 13d | 1 | 0.69mi |
| 4125 High St Lincoln, NE | 3.0 | 1.5 | 1600 | $1,950 | $1.22 | 21d | 1 | 0.99mi |
| 4831 South St Unit 4831 Lincoln, NE | 2.0 | 1.0 | 910 | $1,200 | $1.32 | 43d | 1 | 1.23mi |
| 7201 Pioneers Blvd Lincoln, NE | 1.0–2.0 | 1.0–2.0 | 827 | $1,585 | $1.92 | 13d | 19 | 1.30mi |
| 4121 Normal Blvd Lincoln, NE | 1.0–2.0 | 1.0–2.0 | 857 | $1,265 | $1.48 | 13d | 4 | 1.36mi |
| 5505 Sumner St Lincoln, NE | 3.0 | 2.0 | 1600 | $1,950 | $1.22 | 21d | 1 | 1.39mi |
Listing history 2 events
-
2026-06-07remarks 71-char remark
-
2026-06-07$150,000 Pending
ⓘ Source: listings_history table (triggers on properties + properties_extension) + one-shot
backfill from property_details.listing_events for pre-trigger history.
Tax reassessment forecast NE · Resets to sale price
- Current annual tax
- $2,991 · $249/mo
- Projected year-2 tax
- $2,991 · $249/mo
- Expected delta
- $0/yr ($0/mo · 0.0%)
ⓘ Screening estimate from a state-policy table — verify with the county assessor before closing.
Climate risk First Street
- Flood 1/10 Low FEMA zone X (unshaded) · 0% chance over 30 yrs
- Wildfire 1/10 Low
- Heat 3/10 Moderate 7 d/yr ≥104°F today · 16 d/yr by 30 yrs out
- Wind 2/10 Low
- Air quality 1/10 Low 0 unhealthy d/yr today · 0 by 30 yrs out
Nearby sold comps map
Loading sold comps map…
Walkable amenities ~0.75 mi
Loading nearby amenities…
Taxation est. · year 1
- Rental income
- $18,336
- − Mortgage interest
- −$8,402
- − Property taxes
- −$2,991
- − Insurance
- −$750
- − Repairs & maintenance
- −$1,467
- − Management
- −$1,467
- − Depreciation
- −$4,364
- Taxable loss
- −$1,105
- Est. tax savings @ 24.0%
- +$265
- After-tax cash flow
- $1,570/yr
For passive investors: Depreciation is non-cash, so a rental often shows a tax loss while cash-flowing — sheltering income. Rental losses are passive: they offset passive income freely, and up to $25,000/yr can offset ordinary (W-2) income if you actively participate and your MAGI is under $100k (phasing out to $0 by $150k); unused losses carry forward. On sale, claimed depreciation is recaptured at up to 25%, and gains may owe capital-gains tax (a 1031 exchange can defer both). Figures are a year-1 estimate at your 24.0% rate — not tax advice; consult a CPA.
Schools (NCES district)
- District
- Lincoln Public Schools
- NCES district ID
- 3172840
- Math proficiency
- 50% ▼ -6.00%
- Reading proficiency
- 53% ▼ -3.00%
- Median HH income
- $50,273
- Composite
- 44.05/100
- National rank
- #2880
- State rank
- #59 of 111 in NE
Livability — Lincoln
- Score
- 85/100
- State rank
- #5
- US rank
- #545
Category grades
Schools grade is shown separately in the Schools card above.
Census & demographics
- Census place
- Lincoln, NE
- County
- Lancaster County · 291,509 people
- City population
- 291,509
- Metro
- Lincoln, NE
- Population (ZIP)
- 27,531
- Household income
- $72,637
- Rent vs Own
- Severe rent burden
- 1150.0
Population outlook (Lancaster County) Hauer SSP2
- Today (2025)
- 352,806 people
- By 2030
- 377,899 · +7.1%
- By 2040
- 428,582 · +21.5%
- By 2050
- 483,103 · +36.9%
- By 2075
- 632,390 · +79.2%
- By 2100
- 759,513 · +115.3%
Race, ethnicity, and origin ACS 2023
- Neighborhood character
- Predominantly White (81%)
- Race & ethnicity
- White 81% Hispanic / Latino 8% Two or more races 6% Asian 3% Black 1% Native American 1%
- Hispanic origin (detail)
- Mexican 5%
- Common ancestry
- Lithuanian 2% Portuguese 2% Italian 2%
- Foreign-born
- 7% · Canada, China, Philippines
- Languages at home
- 89% English-only · Spanish 4% Other Asian/Pacific 1% Chinese 1%
Political lean MEDSL · Lancaster
- 2024 margin
- Toss-up / Even · D 51.4% · R 47.1% · Other 1.5%
- 2008→2024 swing
- -0.7pp no change · 2008: 5.0pp · 2024: 4.3pp
- All cycles
- 2024: D+4.3 2020: D+7.8 2016: D+0.1 2012: R+1.0 2008: D+5.0
Not yet ingested
- Civics
- —
Market trends
- HPI YoY
- ▼ -253.20%
- Current HPI
- 234.2428
- Rent YoY
- ▲ 3.67%
- Metro
- Lincoln, NE
- State GDP YoY
- ▲ 0.68%
- F500 in state
- 2
Industry mix (Fortune 500 HQ in NE)
| Industry | F500 HQs | Revenue |
|---|---|---|
| Conglomerate | 1 | $371B |
|
||
Price history
+47.1% since first listed7 events — show timeline
- 2026-06-05 Listing Removed — GPRMLS
- 2026-06-05 Listed $150,000 GPRMLS
- 2017-06-14 Sold (Public Records) $140,000 Public Records
- 2017-06-13 Sold (MLS) $140,000 GPRMLS
- 2017-05-02 Listing Removed — GPRMLS
- 2017-04-14 Listed $140,000 GPRMLS
- 2017-04-11 Sold (Public Records) $102,000 Public Records
Property tax history
+3.4%/yrLatest (2025): $2,991 · -3.3% YoY. Source: county tax records.
Cash-flow waterfall
monthlySold comps — $/sqft
last 12 mo · ≤1 miLoading sold comps…