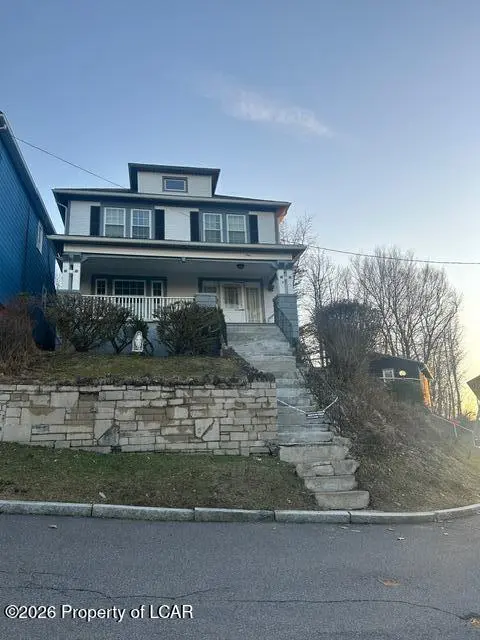
1 Rutter Street St
Hanover, PA 18706
$184,900D
6 bd · 2.0 ba ·
1,920 sqft ·
Built 1930
· SingleFamily
· Active
· 104 DOM
Cashflow @ list (25.0% down · 7.5%)
Estimated rent
$1,844/mo
Mortgage (P&I)
−$970
Tax + insurance
−$272
HOA
−$0
Vac / Maint / Mgmt
−$387
Net cashflow
$215/mo
Annual
$2,582/yr
Cap rate
7.69%
Cash-on-cash
4.99%
DSCR
1.22
1% rule
1.00%
Cash to close
$51,772
Investor read
- This is a 6-bed/2.0-bath single-family listed at $185k.
- At list price, monthly cash flow is $215 ($3k/yr) — positive.
- The deal already cash-flows at list — no discount required.
- To meet the 1% rule (rent ≥ 1% of price), the offer needs to be $184k (0.3% below list).
- It's been on market 104 days — a 9% lower offer ($168k) is reasonable based on typical stale-listing flexibility.
- Recommended offer: $168k (9.0% below list) — sets the bar for market timing.
- Local home prices are declining (-3.0%/yr); year-one equity from $1k of loan paydown is wiped out by about $6k of value loss. Plan a longer hold.
- Location reads 76/100 on livability (#373 in PA, #3,295 nationally) — a middle-class / working-renter tenant base. Strengths: cost of living A+, housing A+, health & safety A+; Watch: amenities C-, employment D, commute F.
- Hanover Area SD (suburban): math 19% / reading 25% proficiency, ranked #484 of 539 in PA (top 90%) — low school quality limits family demand, transient renter base, plan for 1-2y turnover.
- Zoned schools: Hanover Green El Sch (308 students, 94% FRL); Hanover Area Memorial El Sch (math 8% / reading 22%, grade F, #1,323 of 1,518 statewide, top 89%, 310 students, 99% FRL); Hanover Area Jshs (math 27% / reading 27%, grade F, #365 of 437 statewide, top 85%, 930 students, 84% FRL) — zoned schools average 92% FRL vs 48% district-wide (45 pts higher); higher-poverty schools than district average — tighter screening recommended.
- Watch-outs: built in 1930 — expect roof / HVAC / electrical / plumbing capex.
- Market conditions: 83 active listings in the ZIP; 349 units permitted in Luzerne County in 2024 (16 in 5+ unit buildings).
- Luzerne County population projected at +4% by 2050 — modest demand growth; plan on rents tracking national, not racing it.
- Cap rate 7.7% vs local median 3.7% in Hanover — top-decile yield for the area; either an underpriced asset or a hidden risk that comps aren't pricing in. Stress-test before assuming the spread holds.
- This rent runs 38% of the median local income ($59k/yr) — at the standard rent-burdened threshold; future hikes will face affordability resistance.
Questions for listing agent
- It's been on market 104 days. Have you received any prior offers? Is the seller open to a 9% concession, seller financing, or rate buy-down credit?
- Built in 1930 — when were the roof, HVAC, electrical panel, plumbing, and water heater last replaced?
- Why hasn't it sold? Are there any deal-killer items the seller is aware of (foundation, flood, title, zoning, code violations)?
- Is there a deadline driving the sale (1031 exchange, divorce, estate, relocation)? That informs how much negotiation room exists.
- The area grade is low — what's the realistic commute time and amenity access for the typical tenant pool here? Any planned neighborhood developments (good or bad) we should know about?
- What's the average days-on-market for RENTAL listings here right now (not sales)? A rising rental-DOM trend means longer vacancies and softer asking-rent achievability than the comps imply.
- What's the recent tenant-quality profile in this submarket — average credit score on applications, eviction rate, late-payment / NSF rate, and stable-employment percentage? A property-management company in the area should have these aggregated.
- How much new for-sale + rental construction is in the pipeline within 1–3 miles? Heavy new supply typically softens prices + rents 12–24 months out; constrained supply supports both.
CashFlowRE · CFR-F73FMKCF1JEM5Y
· Data 17 h ago
cashflowre.app · 2026-05-29