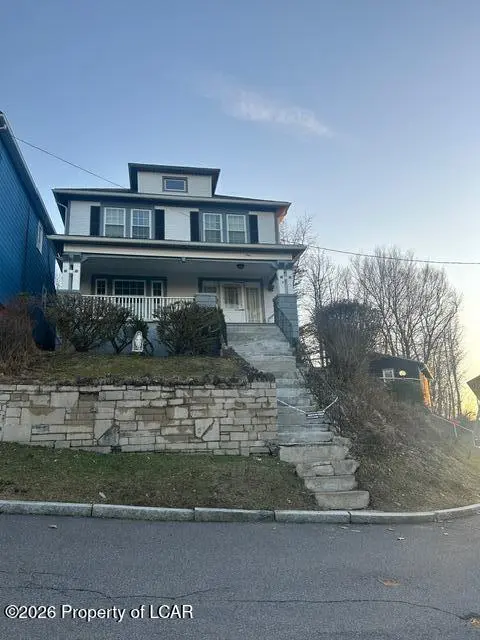
1 Rutter Street St · Hanover, PA
Flood risk 1/10 · Minimal
- FEMA flood zone
- X (unshaded)
- Chance of flooding over 30 yrs
- 0.0%
- Est. flood insurance / yr
- $507 – $1,088
Fire risk 3/10 · Minor
- Est. fire insurance / yr
- $511 – $949
Heat risk 3/10 · Minor
- Hot days now (above 96°F)
- 7 days/yr
- Hot days in 30 yrs
- 15 days/yr
Wind risk 3/10 · Minor
- Chance of severe wind over 30 yrs
- 5.0%
Air-quality risk 2/10 · Minimal
- Unhealthy air days now
- 1 days/yr
- Unhealthy air days in 30 yrs
- 2 days/yr
Risk factors via First Street. Map © Google.
Why this score? — see what drove the D grade
The composite is a weighted blend of 9 inputs, each scored 0–100. Each bar is that input's sub-score; the figure is the points it added to the 100-point composite (weight × sub-score).
- Cash flow +19.7/30.0
- DSCR +6.2/10.0
- 1% rule +5.0/10.0
- Livability +3.8/5.0
- Rent growth +2.5/5.0
- Condition / age +2.5/5.0
- Schools +1.9/10.0
- ARV discount +0.0/15.0
- Appreciation +0.0/10.0
$184,900
🖨 Deal sheet (PDF) 📄 Offer letter ✓ Due diligence
Listing remarks MLS
This big single home could be the perfect place to call home with original woodwork, beautiful French doors, and wide staircase. In addition to the 6 bedrooms, it has a full bath on 1st & 2nd floor, walk up attic for storage, and a 3 car garage for storage. Recent updates, 11 new Windows, fresh paint, some new carpet, new dishwasher, new HWH, new roof, windows, siding on garage.
Key facts
- Wide staircase
- Walk up attic
- 3 car garage
Tags
Neighborhood map
What this means for you Summary
Snapshot
- This is a 6-bed/2.0-bath single-family listed at $185k.
Deal economics
- At list price, monthly cash flow is $215 ($3k/yr) — positive.
- The deal already cash-flows at list — no discount required.
- To meet the 1% rule (rent ≥ 1% of price), the offer needs to be $184k (0.3% below list).
- Recommended offer: $168k (9.0% below list) — sets the bar for market timing.
- Cap rate 7.7% vs local median 3.7% in Hanover — top-decile yield for the area; either an underpriced asset or a hidden risk that comps aren't pricing in. Stress-test before assuming the spread holds.
Location & tenants
- Location reads 76/100 on livability (#373 in PA, #3,295 nationally) — a middle-class / working-renter tenant base. Strengths: cost of living A+, housing A+, health & safety A+; Watch: amenities C-, employment D, commute F.
- Hanover Area SD (suburban): math 19% / reading 25% proficiency, ranked #484 of 539 in PA (top 90%) — low school quality limits family demand, transient renter base, plan for 1-2y turnover.
- Zoned schools: Hanover Green El Sch (308 students, 94% FRL); Hanover Area Memorial El Sch (math 8% / reading 22%, grade F, #1,323 of 1,518 statewide, top 89%, 310 students, 99% FRL); Hanover Area Jshs (math 27% / reading 27%, grade F, #365 of 437 statewide, top 85%, 930 students, 84% FRL) — zoned schools average 92% FRL vs 48% district-wide (45 pts higher); higher-poverty schools than district average — tighter screening recommended.
- Market conditions: 83 active listings in the ZIP; 349 units permitted in Luzerne County in 2024 (16 in 5+ unit buildings).
- This rent runs 38% of the median local income ($59k/yr) — at the standard rent-burdened threshold; future hikes will face affordability resistance.
Forward outlook
- Local home prices are declining (-3.0%/yr); year-one equity from $1k of loan paydown is wiped out by about $6k of value loss. Plan a longer hold.
- Luzerne County population projected at +4% by 2050 — modest demand growth; plan on rents tracking national, not racing it.
Negotiation context
- It's been on market 104 days — a 9% lower offer ($168k) is reasonable based on typical stale-listing flexibility.
Risks & watch-outs
- Watch-outs: built in 1930 — expect roof / HVAC / electrical / plumbing capex.
Questions for the listing agent
- It's been on market 104 days. Have you received any prior offers? Is the seller open to a 9% concession, seller financing, or rate buy-down credit?
- Built in 1930 — when were the roof, HVAC, electrical panel, plumbing, and water heater last replaced?
- Why hasn't it sold? Are there any deal-killer items the seller is aware of (foundation, flood, title, zoning, code violations)?
- Is there a deadline driving the sale (1031 exchange, divorce, estate, relocation)? That informs how much negotiation room exists.
- The area grade is low — what's the realistic commute time and amenity access for the typical tenant pool here? Any planned neighborhood developments (good or bad) we should know about?
- What's the average days-on-market for RENTAL listings here right now (not sales)? A rising rental-DOM trend means longer vacancies and softer asking-rent achievability than the comps imply.
- What's the recent tenant-quality profile in this submarket — average credit score on applications, eviction rate, late-payment / NSF rate, and stable-employment percentage? A property-management company in the area should have these aggregated.
- How much new for-sale + rental construction is in the pipeline within 1–3 miles? Heavy new supply typically softens prices + rents 12–24 months out; constrained supply supports both.
Investment metrics
- 1% rule
- 1.00% ✗
- Cap rate
- 7.69%
- Cash-on-cash
- 4.99%
- DSCR
- 1.22
- GRM
- 8.4
CMA / ARV
- ARV (median comp)
- $153,643
- List price
- $184,900
- Delta
- 20.34%
- Verdict
- OVERPRICED
- Comps
- 2 within 1.0 mi
Show comp detail 3 sales within ~0.75 mi
| Address | Dist | Beds/Ba | Sqft | Sold | Price | $/sf | Match |
|---|---|---|---|---|---|---|---|
| 530 High St | 0.51mi | 5/1.0 (-1) | 1,801 (-6%) | 7mo | $245,000 | $136 | 51 |
| 10 Mccabe St | 0.54mi | 5/1.0 (-1) | 1,848 (-4%) | 19mo | $55,000 | $30 | 44 |
| 201 Grove St | 0.53mi | 5/2.5 (-1) | 2,200 (+15%) | 14mo | $277,000 | $126 | 32 |
Match score weights: distance 35% · size 25% · config 20% · recency 20%. Top-matched comps best support the ARV.
Projected returns pro-forma
-3.0% appreciation · 3.0% rent growth · sell at horizon
- IRR
- -8.5%
- Equity multiple
- 0.69×
- Total profit
- $-16,250
- Equity at exit
- $27,569
- IRR
- 1.0%
- Equity multiple
- 1.07×
- Total profit
- $3,522
- Equity at exit
- $15,987
Cash invested: $51,772 (down + closing). Projections, not guarantees.
Landlord ↔ Tenant lean methodology
- Overall (STATE)
- 62 Landlord-Friendly
- State Pennsylvania
- 62 Landlord-Friendly · EVEN
- County
- — inherits STATE
- City
- — inherits STATE
ZIP-level market 18706
- Active inventory
- 83
- Price-to-rent
- 8.4×
Monthly cashflow live
- Estimated rent
- $1,844 medium interval (Pro) →
- Mortgage (P&I)
- −$970
- Tax from tax record
- −$195 /mo · $2,338/yr
- Insurance
- −$77
- HOA
- −$0
- Vacancy / Maint / Mgmt
- −$387
- Net cashflow
- $215
Break-even live
Sensitivity live
| Price | -10% $320 | -5% $268 | +0% $215 | +5% $163 | +10% $111 |
|---|---|---|---|---|---|
| Rent | -10% $70 | -5% $142 | +0% $215 | +5% $288 | +10% $361 |
| Rate | -1.0pp $308 | -0.5pp $262 | base $215 | +0.5pp $167 | +1.0pp $119 |
UW: 25.0% down · 7.5% · 30yr · 1.5% tax · 5.0% vac · 8.0% maint · 8.0% mgmt
Financing live
Cash to close
- Down payment
- $46,225
- Closing costs
- $5,547
- Reserves months
- —
- Total cash needed
- —
Loan-product check · same deal, 3 products live
Conventional
25% down · 7.5% · 30yr
- Down + closing
- —
- Monthly P&I
- —
- Monthly cashflow
- —
- DSCR
- —
- Eligible?
- —
Personal DTI + credit; lowest rate.
DSCR
20% down · 8.5% · 30yr
- Down + closing
- —
- Monthly P&I
- —
- Monthly cashflow
- —
- DSCR
- —
- Eligible?
- —
No personal income docs; deal must DSCR.
Hard money
10% down · 12.0% · 12mo
- Down + closing
- —
- Monthly P&I
- —
- Monthly cashflow
- —
- DSCR
- —
- Eligible?
- —
Short-term bridge; refi at stabilization.
Listing history 20 events
-
2026-06-21days on market $184,900 Active 104 DOM
-
2026-06-18days on market $184,900 Active 101 DOM
-
2026-06-17days on market $184,900 Active 100 DOM
-
2026-06-16days on market $184,900 Active 99 DOM
-
2026-06-15days on market $184,900 Active 98 DOM
-
2026-06-14days on market $184,900 Active 96 DOM
-
2026-06-13days on market $184,900 Active 95 DOM
-
2026-06-10pricedays on market $184,900 Active 93 DOM
-
2026-06-09days on market $190,000 Active 92 DOM
-
2026-06-08days on market $190,000 Active 91 DOM
-
2026-06-07remarks 402-char remark
-
2026-06-07days on market $190,000 Active 90 DOM
-
2026-06-02days on market $190,000 Active 85 DOM
-
2026-06-01days on market $190,000 Active 84 DOM
-
2026-05-31days on market $190,000 Active 83 DOM
-
2026-05-30days on market $190,000 Active 82 DOM
-
2026-05-13price $190,000 387-char remark
Show marketing remark (387 chars)
This big single home could be the perfect place to call home with original woodwork, beautiful French doors, and wide staircase. In addition to the 6 bedrooms, it has a full bath on 1st & 2nd floor, walk up attic for storage, and a 3 car garage for storage. Recent updates, 11 new Windows, fresh paint, some new carpet, new dishwasher, new HWH, new roof, windows, siding on garage.
-
2026-04-17price $180,000 387-char remark
Show marketing remark (387 chars)
This big single home could be the perfect place to call home with original woodwork, beautiful French doors, and wide staircase. In addition to the 6 bedrooms, it has a full bath on 1st & 2nd floor, walk up attic for storage, and a 3 car garage for storage. Recent updates, 11 new Windows, fresh paint, some new carpet, new dishwasher, new HWH, new roof, windows, siding on garage.
-
2026-03-09$170,000 Active 387-char remark
Show marketing remark (387 chars)
This big single home could be the perfect place to call home with original woodwork, beautiful French doors, and wide staircase. In addition to the 6 bedrooms, it has a full bath on 1st & 2nd floor, walk up attic for storage, and a 3 car garage for storage. Recent updates, 11 new Windows, fresh paint, some new carpet, new dishwasher, new HWH, new roof, windows, siding on garage.
-
2025-09-29price $165,000
ⓘ Source: listings_history table (triggers on properties + properties_extension) + one-shot
backfill from property_details.listing_events for pre-trigger history.
Tax reassessment forecast PA · Partial reset (capped growth)
- Current annual tax
- $2,338 · $195/mo
- Projected year-2 tax
- $2,630 · $219/mo
- Expected delta
- +$292/yr (+$24/mo · 12.5%)
ⓘ Screening estimate from a state-policy table — verify with the county assessor before closing.
Climate risk First Street
- Flood 1/10 Low FEMA zone X (unshaded) · 0% chance over 30 yrs
- Wildfire 3/10 Moderate
- Heat 3/10 Moderate 7 d/yr ≥96°F today · 15 d/yr by 30 yrs out
- Wind 3/10 Moderate 5% chance of damaging wind over 30 yrs
- Air quality 2/10 Low 1 unhealthy d/yr today · 2 by 30 yrs out
Nearby sold comps map
Loading sold comps map…
Walkable amenities ~0.75 mi
Loading nearby amenities…
Taxation est. · year 1
- Rental income
- $22,127
- − Mortgage interest
- −$10,357
- − Property taxes
- −$2,338
- − Insurance
- −$924
- − Repairs & maintenance
- −$1,770
- − Management
- −$1,770
- − Depreciation
- −$5,379
- Taxable loss
- −$412
- Est. tax savings @ 24.0%
- +$99
- After-tax cash flow
- $2,681/yr
For passive investors: Depreciation is non-cash, so a rental often shows a tax loss while cash-flowing — sheltering income. Rental losses are passive: they offset passive income freely, and up to $25,000/yr can offset ordinary (W-2) income if you actively participate and your MAGI is under $100k (phasing out to $0 by $150k); unused losses carry forward. On sale, claimed depreciation is recaptured at up to 25%, and gains may owe capital-gains tax (a 1031 exchange can defer both). Figures are a year-1 estimate at your 24.0% rate — not tax advice; consult a CPA.
Schools (NCES district)
- District
- Hanover Area SD
- NCES district ID
- 4211420
- Math proficiency
- 19% ▼ -3.00%
- Reading proficiency
- 25% ▼ -21.00%
- Median HH income
- $40,015
- Composite
- 18.6/100
- National rank
- #8903
- State rank
- #484 of 539 in PA
Livability — Hanover
- Score
- 76/100
- State rank
- #373
- US rank
- #3295
Category grades
Schools grade is shown separately in the Schools card above.
Census & demographics
- County
- Luzerne County · 118,885 people
- City population
- 56,443
- Metro
- Scranton--Wilkes-Barre, PA
- Population (ZIP)
- 16,387
- Household income
- $58,558
- Rent vs Own
- Severe rent burden
- 568.0
Population outlook (Luzerne County) Hauer SSP2
- Today (2025)
- 319,505 people
- By 2030
- 319,943 · +0.1%
- By 2040
- 322,643 · +1.0%
- By 2050
- 330,817 · +3.5%
- By 2075
- 379,145 · +18.7%
- By 2100
- 431,908 · +35.2%
Race, ethnicity, and origin ACS 2023
- Neighborhood character
- Predominantly White (76%)
- Race & ethnicity
- White 76% Hispanic / Latino 17% Two or more races 11% Black 3%
- Hispanic origin (detail)
- Puerto Rican 9% Dominican 4%
- Common ancestry
- Romanian 18% Scotch-Irish 3% Subsaharan African 1%
- Foreign-born
- 6% · Canada
- Languages at home
- 88% English-only · Spanish 10% Other Asian/Pacific 1%
Political lean MEDSL · Luzerne
- 2024 margin
- R (+19.2) · D 40.0% · R 59.2%
- 2008→2024 swing
- -27.6pp toward R · 2008: 8.4pp · 2024: -19.2pp
- All cycles
- 2024: R+19.2 2020: R+14.4 2016: R+19.6 2012: D+4.8 2008: D+8.4
Not yet ingested
- Civics
- —
Market trends
- HPI YoY
- ▼ -150.02%
- Current HPI
- 196.19
- Rent YoY
- —
- Metro
- Scranton--Wilkes-Barre, PA
- State GDP YoY
- ▲ 1.68%
- F500 in state
- 34
Industry mix (Fortune 500 HQ in PA)
| Industry | F500 HQs | Revenue |
|---|---|---|
| Healthcare | 2 | $309B |
|
||
| Insurance | 2 | $27B |
|
||
| Telecommunications / Media | 1 | $124B |
|
||
| Industrial Distribution | 1 | $22B |
|
||
| Financial Services | 1 | $20B |
|
||
| Chemicals / Materials | 1 | $18B |
|
||
Price history
+15.2% since first listed4 events — show timeline
- 2026-05-13 Price Changed $190,000 LCAR
- 2026-04-17 Price Changed $180,000 LCAR
- 2026-03-09 Listed $170,000 LCAR
- 2025-09-29 Price Changed $165,000 LCAR
Property tax history
+0.8%/yrLatest (2026): $2,338 · +0.3% YoY. Source: county tax records.
Cash-flow waterfall
monthlySold comps — $/sqft
last 12 mo · ≤1 miLoading sold comps…