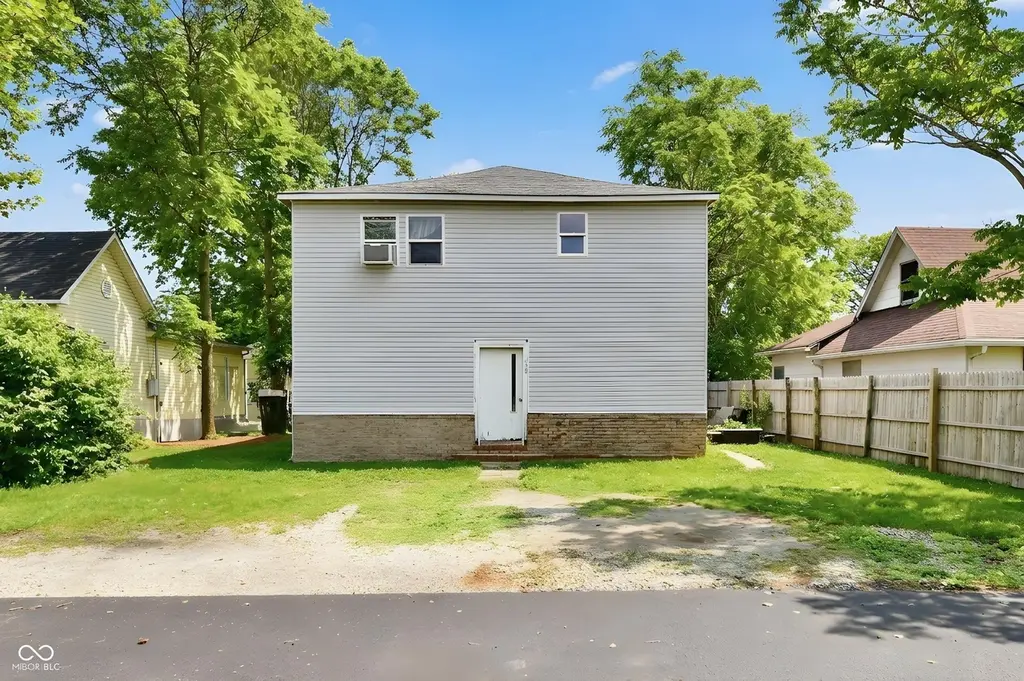
528 South St
Noblesville, IN 46060
$375,000C
4 bd · 2.0 ba ·
2,330 sqft ·
Built 1900
· MultiFamily
· Active
· 23 DOM
Cashflow @ list (25.0% down · 7.5%)
Estimated rent
$4,375/mo
Mortgage (P&I)
−$1,967
Tax + insurance
−$479
HOA
−$0
Vac / Maint / Mgmt
−$919
Net cashflow
$1,011/mo
Annual
$12,130/yr
Cap rate
9.53%
Cash-on-cash
11.55%
DSCR
1.51
1% rule
1.17%
Cash to close
$105,000
Investor read
- This is a 2×2bd/1ba + 1×1bd/1ba units multifamily listed at $375k.
- At list price, monthly cash flow is $1k ($12k/yr) — positive. Per door: $337/mo.
- The deal already cash-flows at list — no discount required.
- Meets the 1% rule at list price ($4k rent vs $375k).
- It's been on market 23 days — a 2% lower offer ($369k) is reasonable based on typical stale-listing flexibility.
- Recommended offer: $369k (1.5% below list) — sets the bar for market timing.
- Local home prices are declining (-3.0%/yr); year-one equity from $3k of loan paydown is wiped out by about $11k of value loss. Plan a longer hold.
- Location reads 86/100 on livability (#3 in IN, #446 nationally) — a professional / high-income tenant draw. Strengths: crime A+, employment A+, cost of living A+; Watch: commute F.
- Noblesville Schools (suburban): math 51% / reading 57% proficiency, ranked #26 of 301 in IN (top 9%) — acceptable for families but not a draw, mixed tenant base, ~2y average lease; only 18% free/reduced lunch — higher-income household profile.
- Watch-outs: built in 1900 — expect roof / HVAC / electrical / plumbing capex.
- Market conditions: Rents rising (+1.8%/yr); 451 active listings in the ZIP; 3 comparable units currently listed for rent nearby; rentals at typical pace (median 24d on market — plan ~3-4 weeks tenant-placement turnaround); solid renter incomes; 4,661 units permitted in Hamilton County in 2024 (1,528 in 5+ unit buildings).
- Hamilton County population projected at +44% by 2050 — long-run rental-demand tailwind backs the buy-and-hold thesis.
- Cap rate 9.5% vs local median 3.2% in Noblesville — top-decile yield for the area; either an underpriced asset or a hidden risk that comps aren't pricing in. Stress-test before assuming the spread holds.
- At $4,375/mo this rent would consume 57% of the median local household income ($92k/yr) (locally 641% of renters already pay >50% of income on rent) — very limited rent-growth headroom before tenants either downsize or default.
Questions for listing agent
- Can we see the unit-by-unit rent roll, current vacancy, and any below-market leases? What's the average tenancy length?
- What capital expenditures (roof, boiler, parking lot, exteriors) have been made in the last 5 years, and what's planned in the next 2?
- Built in 1900 — when were the roof, HVAC, electrical panel, plumbing, and water heater last replaced?
- Is there a deadline driving the sale (1031 exchange, divorce, estate, relocation)? That informs how much negotiation room exists.
- Schools are B-rated — typically a magnet for longer-tenancy family renters. What's the average tenant stay here, and is there a school-zone premium baked into asking?
- What's the average days-on-market for RENTAL listings here right now (not sales)? A rising rental-DOM trend means longer vacancies and softer asking-rent achievability than the comps imply.
- What's the recent tenant-quality profile in this submarket — average credit score on applications, eviction rate, late-payment / NSF rate, and stable-employment percentage? A property-management company in the area should have these aggregated.
- How much new apartment / multifamily construction is in the pipeline within 1–3 miles? Heavy new supply (>2% of stock underway) typically softens rents 12–24 months out; light construction supports rent growth.
CashFlowRE · CFR-F8C2N7BH0T2F6N
· Data 2 days ago
cashflowre.app · 2026-05-29