 Triplex
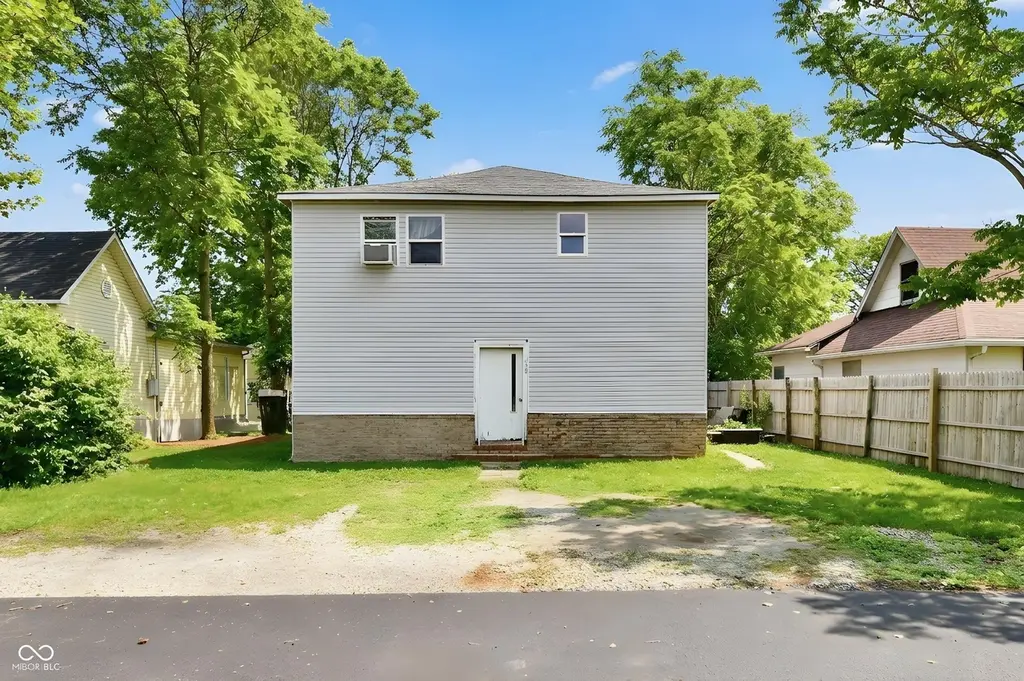
528 South St · Noblesville, IN
Flood risk 1/10 · Minimal
- FEMA flood zone
- X (unshaded)
- Chance of flooding over 30 yrs
- 0.0%
- Est. flood insurance / yr
- $507 – $1,088
Fire risk 3/10 · Minor
- Est. fire insurance / yr
- $717 – $1,331
Heat risk 3/10 · Minor
- Hot days now (above 101°F)
- 7 days/yr
- Hot days in 30 yrs
- 18 days/yr
Wind risk 2/10 · Minimal
- Chance of severe wind over 30 yrs
- —
Air-quality risk 2/10 · Minimal
- Unhealthy air days now
- 1 days/yr
- Unhealthy air days in 30 yrs
- 1 days/yr
Risk factors via First Street. Map © Google.
Why this score? — see what drove the C grade
The composite is a weighted blend of 9 inputs, each scored 0–100. Each bar is that input's sub-score; the figure is the points it added to the 100-point composite (weight × sub-score).
- Cash flow +26.7/30.0
- DSCR +9.1/10.0
- 1% rule +6.7/10.0
- Schools +4.8/10.0
- Livability +4.3/5.0
- Rent growth +2.9/5.0
- Condition / age +2.5/5.0
- ARV discount +0.0/15.0
- Appreciation +0.0/10.0
$375,000
🖨 Deal sheet 📄 Offer letter ✓ Due diligence
Multi-family units
County records classify this as Multi-Family (2-4 Unit). Listing-text estimate: 3 units. confirmed
Listing remarks
Triplex located just minutes from downtown Noblesville, offering a strong value-add opportunity. Property includes three units: one finished and occupied main-level unit featuring 2 bedrooms and 1 bathroom generating current income. Two additional units are vacant and ready for completion. The second main-level unit is a 1 bedroom, 1 bathroom space with demolition started and ready for renovation. The upper-level unit is a 2 bedroom, 1 bathroom layout with demo work begun. Excellent opportunity for investors or owner-occupants seeking to complete renovations and establish additional rental income potential. Convenient location near downtown amenities, dining, and services.
Key facts
- Ready for renovation
- Ready for completion
- 6,970 sq ft lot
Tags
Property features AI
Finance
- Financial info: Total of 3 units; Gross income reported as 13,200 (annual); Expenses reported as 380; Two units show listed monthly rent of $1,100 and other units have $0 listed
Exterior
- Utilities: Solid waste service not available; Owner pays all utilities
- Home design: Residential income property — triplex; Conversion
- Construction: Lot approximately 0.16 acre
- Exterior features: Frontage road access; Property currently used for residential purposes
Interior
- Kitchen: Private kitchens in each unit
- Bedrooms: One 1-bedroom unit; Two 2-bedroom units
- Interior features: Converted property
Neighborhood map
What this means for you Summary
Snapshot
- This is a 2×2bd/1ba + 1×1bd/1ba units multifamily listed at $375k.
Deal economics
- At list price, monthly cash flow is $1k ($12k/yr) — positive. Per door: $337/mo.
- The deal already cash-flows at list — no discount required.
- Meets the 1% rule at list price ($4k rent vs $375k).
- Recommended offer: $369k (1.5% below list) — sets the bar for market timing.
- Cap rate 9.5% vs local median 3.2% in Noblesville — top-decile yield for the area; either an underpriced asset or a hidden risk that comps aren't pricing in. Stress-test before assuming the spread holds.
Location & tenants
- Location reads 86/100 on livability (#3 in IN, #446 nationally) — a professional / high-income tenant draw. Strengths: crime A+, employment A+, cost of living A+; Watch: commute F.
- Noblesville Schools (suburban): math 51% / reading 57% proficiency, ranked #26 of 301 in IN (top 9%) — acceptable for families but not a draw, mixed tenant base, ~2y average lease; only 18% free/reduced lunch — higher-income household profile.
- Market conditions: Rents rising (+1.8%/yr); 451 active listings in the ZIP; 3 comparable units currently listed for rent nearby; rentals at typical pace (median 24d on market — plan ~3-4 weeks tenant-placement turnaround); solid renter incomes; 4,661 units permitted in Hamilton County in 2024 (1,528 in 5+ unit buildings).
- At $4,375/mo this rent would consume 57% of the median local household income ($92k/yr) (locally 641% of renters already pay >50% of income on rent) — very limited rent-growth headroom before tenants either downsize or default.
Forward outlook
- Local home prices are declining (-3.0%/yr); year-one equity from $3k of loan paydown is wiped out by about $11k of value loss. Plan a longer hold.
- Hamilton County population projected at +44% by 2050 — long-run rental-demand tailwind backs the buy-and-hold thesis.
Negotiation context
- It's been on market 23 days — a 2% lower offer ($369k) is reasonable based on typical stale-listing flexibility.
Risks & watch-outs
- Watch-outs: built in 1900 — expect roof / HVAC / electrical / plumbing capex.
Questions for the listing agent
- Can we see the unit-by-unit rent roll, current vacancy, and any below-market leases? What's the average tenancy length?
- What capital expenditures (roof, boiler, parking lot, exteriors) have been made in the last 5 years, and what's planned in the next 2?
- Built in 1900 — when were the roof, HVAC, electrical panel, plumbing, and water heater last replaced?
- Is there a deadline driving the sale (1031 exchange, divorce, estate, relocation)? That informs how much negotiation room exists.
- Schools are B-rated — typically a magnet for longer-tenancy family renters. What's the average tenant stay here, and is there a school-zone premium baked into asking?
- What's the average days-on-market for RENTAL listings here right now (not sales)? A rising rental-DOM trend means longer vacancies and softer asking-rent achievability than the comps imply.
- What's the recent tenant-quality profile in this submarket — average credit score on applications, eviction rate, late-payment / NSF rate, and stable-employment percentage? A property-management company in the area should have these aggregated.
- How much new apartment / multifamily construction is in the pipeline within 1–3 miles? Heavy new supply (>2% of stock underway) typically softens rents 12–24 months out; light construction supports rent growth.
Investment metrics
- 1% rule
- 1.17% ✓
- Cap rate
- 9.53%
- Cash-on-cash
- 11.55%
- DSCR
- 1.51
- GRM
- 7.1
CMA / ARV
- ARV (on-the-fly)
- $319,210
- Comps found
- 1
Show comp detail 1 sale within ~0.75 mi
| Address | Dist | Beds/Ba | Sqft | Sold | Price | $/sf | Match |
|---|---|---|---|---|---|---|---|
| 410 S 11th St | 0.63mi | 4/3.0 | 2,184 (-6%) | 9mo | $300,000 | $137 | 48 |
Match score weights: distance 35% · size 25% · config 20% · recency 20%. Top-matched comps best support the ARV.
Projected returns pro-forma
-3.0% appreciation · 1.79% rent growth · sell at horizon
- IRR
- -0.4%
- Equity multiple
- 0.98×
- Total profit
- $-1,672
- Equity at exit
- $55,914
- IRR
- 8.0%
- Equity multiple
- 1.57×
- Total profit
- $60,271
- Equity at exit
- $32,423
Cash invested: $105,000 (down + closing). Projections, not guarantees.
Landlord ↔ Tenant lean methodology
- Overall (STATE)
- 90 Strongly Landlord-Friendly
- State Indiana
- 90 Strongly Landlord-Friendly · R+11
- County
- — inherits STATE
- City
- — inherits STATE
ZIP-level market 46060
- Rents YoY
- 1.8%
- Active inventory
- 451
- Price-to-rent
- 20.4×
Monthly cashflow live
- Estimated rent
- $4,375 high interval (Pro) →
- Mortgage (P&I)
- −$1,967
- Tax from tax record
- −$323 /mo · $3,871/yr
- Insurance
- −$156
- HOA
- −$0
- Vacancy / Maint / Mgmt
- −$919
- Net cashflow
- $1,011
Break-even live
3-unit breakdown (identical units grouped — click to expand)
| Units | Beds | Baths | Est. rent |
|---|---|---|---|
| 2× units | 2 | 1 | $3,068 |
| #1 | 2 | 1 | $1,534 |
| #3 | 2 | 1 | $1,534 |
| 1× unit | 1 | 1 | $1,306 |
| Total (3 units) | $4,375 | ||
UW: 25.0% down · 7.5% · 30yr · 1.5% tax · 5.0% vac · 8.0% maint · 8.0% mgmt
Financing live
Cash to close
- Down payment
- $93,750
- Closing costs
- $11,250
- Reserves months
- —
- Total cash needed
- —
Loan-product check · same deal, 3 products live
Conventional
25% down · 7.5% · 30yr
- Down + closing
- —
- Monthly P&I
- —
- Monthly cashflow
- —
- DSCR
- —
- Eligible?
- —
Personal DTI + credit; lowest rate.
DSCR
20% down · 8.5% · 30yr
- Down + closing
- —
- Monthly P&I
- —
- Monthly cashflow
- —
- DSCR
- —
- Eligible?
- —
No personal income docs; deal must DSCR.
Hard money
10% down · 12.0% · 12mo
- Down + closing
- —
- Monthly P&I
- —
- Monthly cashflow
- —
- DSCR
- —
- Eligible?
- —
Short-term bridge; refi at stabilization.
Rent comps 3 comps
| Address | Beds | Baths | Sqft | Rent | $/sqft | DOM | Units | Dist |
|---|---|---|---|---|---|---|---|---|
| 637 Cherry St Noblesville, IN | 3.0 | 2.0 | 2000 | $2,000 | $1.00 | 24d | 1 | 0.67mi |
| 519 James Dr Noblesville, IN | 3.0 | 2.0 | 1596 | $1,890 | $1.18 | 12d | 1 | 1.34mi |
| 7217 Burlat Ln Noblesville, IN | 3.0 | 2.0 | 1646 | $1,995 | $1.21 | 44d | 1 | 1.45mi |
Listing history 15 events
-
2026-06-18days on market $375,000 Active 23 DOM
-
2026-06-17days on market $375,000 Active 22 DOM
-
2026-06-16days on market $375,000 Active 21 DOM
-
2026-06-15days on market $375,000 Active 20 DOM
-
2026-06-13days on market $375,000 Active 18 DOM
-
2026-06-13days on market $375,000 Active 17 DOM
-
2026-06-09days on market $375,000 Active 14 DOM
-
2026-06-08days on market $375,000 Active 13 DOM
-
2026-06-07days on market $375,000 Active 12 DOM
-
2026-06-05days on market $375,000 Active 9 DOM
-
2026-06-03days on market $375,000 Active 8 DOM
-
2026-06-02days on market $375,000 Active 7 DOM
-
2026-06-01days on market $375,000 Active 6 DOM
-
2026-05-31days on market $375,000 Active 5 DOM
-
2026-05-22$375,000 Active
ⓘ Source: listings_history table (triggers on properties + properties_extension) + one-shot
backfill from property_details.listing_events for pre-trigger history.
Tax reassessment forecast IN · Partial reset (capped growth)
- Current annual tax
- $3,871 · $323/mo
- Projected year-2 tax
- $3,871 · $323/mo
- Expected delta
- $0/yr ($0/mo · 0.0%)
ⓘ Screening estimate from a state-policy table — verify with the county assessor before closing.
Climate risk First Street
- Flood 1/10 Low FEMA zone X (unshaded) · 0% chance over 30 yrs
- Wildfire 3/10 Moderate
- Heat 3/10 Moderate 7 d/yr ≥101°F today · 18 d/yr by 30 yrs out
- Wind 2/10 Low
- Air quality 2/10 Low 1 unhealthy d/yr today · 1 by 30 yrs out
Nearby sold comps map
Loading sold comps map…
Walkable amenities ~0.75 mi
Loading nearby amenities…
Taxation est. · year 1
- Rental income
- $52,500
- − Mortgage interest
- −$21,006
- − Property taxes
- −$3,871
- − Insurance
- −$1,875
- − Repairs & maintenance
- −$4,200
- − Management
- −$4,200
- − Depreciation
- −$10,909
- Taxable income
- $6,439
- Est. tax owed @ 24.0%
- −$1,545
- After-tax cash flow
- $10,585/yr
For passive investors: Depreciation is non-cash, so a rental often shows a tax loss while cash-flowing — sheltering income. Rental losses are passive: they offset passive income freely, and up to $25,000/yr can offset ordinary (W-2) income if you actively participate and your MAGI is under $100k (phasing out to $0 by $150k); unused losses carry forward. On sale, claimed depreciation is recaptured at up to 25%, and gains may owe capital-gains tax (a 1031 exchange can defer both). Figures are a year-1 estimate at your 24.0% rate — not tax advice; consult a CPA.
Schools (NCES district)
- District
- Noblesville Schools
- NCES district ID
- 1807650
- Math proficiency
- 51% ▼ -12.00%
- Reading proficiency
- 57% ▼ -8.00%
- Median HH income
- $71,719
- Composite
- 48.16/100
- National rank
- #2177
- State rank
- #26 of 301 in IN
Livability — Noblesville
- Score
- 86/100
- State rank
- #3
- US rank
- #446
Category grades
Schools grade is shown separately in the Schools card above.
Census & demographics
- Census place
- Noblesville, IN
- County
- Hamilton County · 337,479 people
- City population
- 88,670
- Metro
- Indianapolis-Carmel-Anderson, IN
- Population (ZIP)
- 47,610
- Household income
- $91,918
- Rent vs Own
- Severe rent burden
- 641.0
Population outlook (Hamilton County) Hauer SSP2
- Today (2025)
- 381,938 people
- By 2030
- 417,496 · +9.3%
- By 2040
- 486,684 · +27.4%
- By 2050
- 549,805 · +44.0%
- By 2075
- 687,078 · +79.9%
- By 2100
- 754,495 · +97.5%
Race, ethnicity, and origin ACS 2023
- Neighborhood character
- Predominantly White (81%)
- Race & ethnicity
- White 81% Hispanic / Latino 7% Two or more races 6% Black 6% Asian 3%
- Hispanic origin (detail)
- Mexican 3% Puerto Rican 1%
- Common ancestry
- Romanian 3% Slovak 2% Italian 2%
- Foreign-born
- 7% · Canada
- Languages at home
- 91% English-only · Spanish 5% Other Indo-European 2% French/Haitian/Cajun 1%
Political lean MEDSL · Hamilton
- 2024 margin
- Lean R (+6.1) · D 46.0% · R 52.1% · Other 1.9%
- 2008→2024 swing
- +16.2pp toward D · 2008: -22.2pp · 2024: -6.1pp
- All cycles
- 2024: R+6.1 2020: R+6.8 2016: R+19.6 2012: R+34.3 2008: R+22.2
Not yet ingested
- Civics
- —
Market trends
- HPI YoY
- ▼ -165.86%
- Current HPI
- 234.6658
- Rent YoY
- ▲ 1.79%
- Metro
- Indianapolis-Carmel-Anderson, IN
- State GDP YoY
- ▲ 2.90%
- F500 in state
- 18
Industry mix (Fortune 500 HQ in IN)
| Industry | F500 HQs | Revenue |
|---|---|---|
| Industrial Machinery | 2 | $37B |
|
||
| Healthcare | 1 | $177B |
|
||
| Pharmaceuticals | 1 | $45B |
|
||
| Metals / Steel | 1 | $18B |
|
||
| Agriculture | 1 | $17B |
|
||
| Packaging | 1 | $12B |
|
||
Price history
1 event — show timeline
- 2026-05-22 Listed $375,000 MIBOR as Distributed by MLS Grid
Property tax history
+6.6%/yrLatest (2025): $3,871 · +7.7% YoY. Source: county tax records.
Cash-flow waterfall
monthlySold comps — $/sqft
last 12 mo · ≤1 miLoading sold comps…