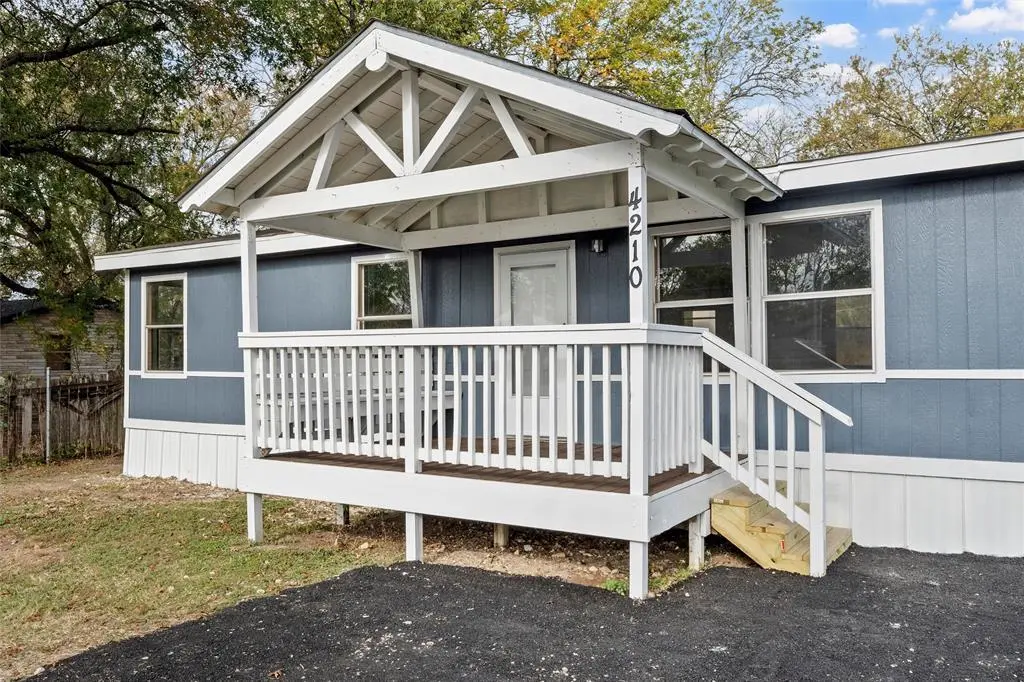
4210 Wheeler St
Bellmead, TX 76705
$199,000D
3 bd · 2.0 ba ·
1,456 sqft ·
Built 1984
· Manufactured
· Active
· 197 DOM
Cashflow @ list (25.0% down · 7.5%)
Estimated rent
$1,537/mo
Mortgage (P&I)
−$1,044
Tax + insurance
−$125
HOA
−$0
Vac / Maint / Mgmt
−$323
Net cashflow
$46/mo
Annual
$551/yr
Cap rate
6.57%
Cash-on-cash
0.99%
DSCR
1.04
1% rule
0.77%
Cash to close
$55,720
Investor read
- This is a 3-bed/2.0-bath manufactured listed at $199k.
- At list price, monthly cash flow is $46 ($551/yr) — positive.
- The deal already cash-flows at list — no discount required.
- To meet the 1% rule (rent ≥ 1% of price), the offer needs to be $154k (22.8% below list).
- It's been on market 197 days — a 12% lower offer ($175k) is reasonable based on typical stale-listing flexibility.
- Recommended offer: $154k (22.8% below list) — sets the bar for 1% rule.
- Local home prices are declining (-3.0%/yr); year-one equity from $1k of loan paydown is wiped out by about $6k of value loss. Plan a longer hold.
- Location reads 63/100 on livability (#893 in TX) — a middle-class / working-renter tenant base. Strengths: cost of living A+, housing A+; Watch: employment D+, schools F, crime F.
- La Vega ISD (suburban): math 24% / reading 32% proficiency, ranked #680 of 826 in TX (top 82%) — low school quality limits family demand, transient renter base, plan for 1-2y turnover; 79% free/reduced lunch — lower-income household profile, screen leases tightly.
- Market conditions: Rents rising (+2.2%/yr); 297 active listings in the ZIP; 9 comparable units currently listed for rent nearby; rentals at typical pace (median 21d on market — plan ~3-4 weeks tenant-placement turnaround); 1,014 units permitted in McLennan County in 2024 (200 in 5+ unit buildings).
- McLennan County population projected at +17% by 2050 — long-run rental-demand tailwind backs the buy-and-hold thesis.
- Climate carrying-cost: major wind risk, 64% chance of damaging wind over 30y; extreme-heat days projected 7→24/yr by 2055 (HVAC capex compounding) — expect insurance premiums to compound above CPI over the hold.
- Cap rate 6.6% vs local median 5.1% in Bellmead — meaningfully above typical; check what's discounted (condition, days-on-market, listing class) to confirm the premium yield is real.
- This rent runs 32% of the median local income ($58k/yr) — at the standard rent-burdened threshold; future hikes will face affordability resistance.
Questions for listing agent
- It's been on market 197 days. Have you received any prior offers? Is the seller open to a 23% concession, seller financing, or rate buy-down credit?
- Why hasn't it sold? Are there any deal-killer items the seller is aware of (foundation, flood, title, zoning, code violations)?
- Is there a deadline driving the sale (1031 exchange, divorce, estate, relocation)? That informs how much negotiation room exists.
- Schools are F-rated, which usually means shorter tenancies and higher turnover. Who's the typical renter profile here, and what's been the actual vacancy rate?
- Crime grade is F in this area — have there been break-ins, vandalism, or insurance claims at this property in the last 3 years? What carrier currently insures it and at what premium?
- The area grade is low — what's the realistic commute time and amenity access for the typical tenant pool here? Any planned neighborhood developments (good or bad) we should know about?
- What's the average days-on-market for RENTAL listings here right now (not sales)? A rising rental-DOM trend means longer vacancies and softer asking-rent achievability than the comps imply.
- What's the recent tenant-quality profile in this submarket — average credit score on applications, eviction rate, late-payment / NSF rate, and stable-employment percentage? A property-management company in the area should have these aggregated.
CashFlowRE · CFR-F95FKAB011DAYP
· Data 1 day ago
cashflowre.app · 2026-05-29