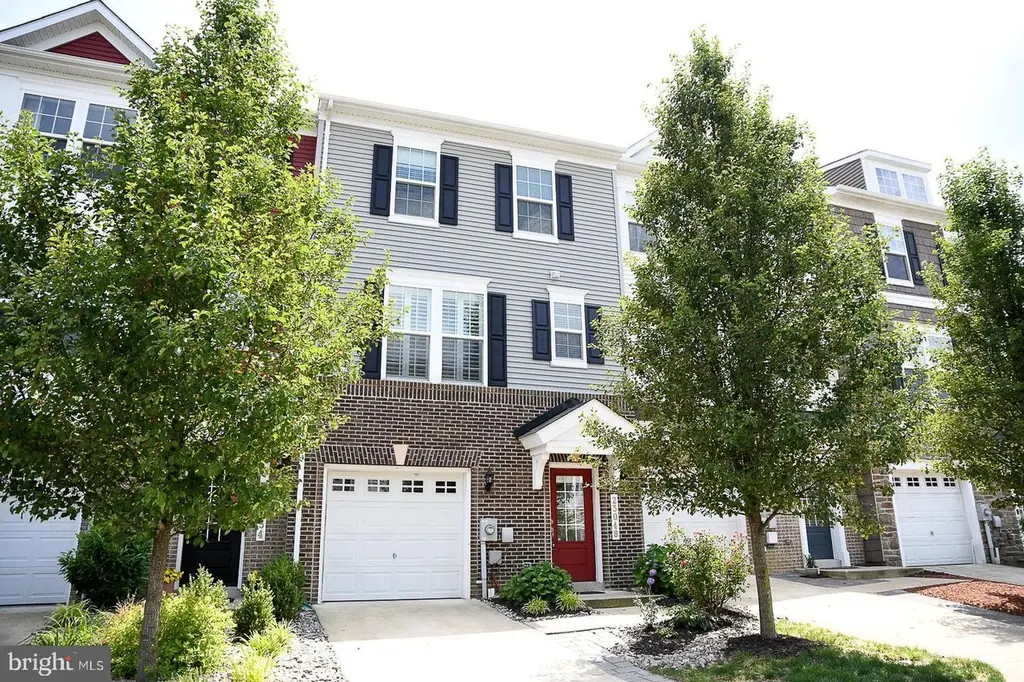
23048 Mountain Laurel Ln
Wildewood, MD 20619
$415,000D-
4 bd · 2.5 ba ·
2,188 sqft ·
Built 2017
· Townhouse
· Active
· 6 DOM
Cashflow @ list (25.0% down · 7.5%)
Estimated rent
$3,042/mo
Mortgage (P&I)
−$2,176
Tax + insurance
−$463
HOA
−$127
Vac / Maint / Mgmt
−$639
Net cashflow
$-364/mo
Annual
$-4,365/yr
Cap rate
5.24%
Cash-on-cash
-3.76%
DSCR
0.83
1% rule
0.73%
Cash to close
$116,200
Investor read
- This is a 4-bed/2.5-bath townhouse listed at $415k.
- At list price, monthly cash flow is $-364 ($-4k/yr) — negative.
- To cash-flow at today's rent, offer at most $351k (15.5% below list).
- To meet the 1% rule (rent ≥ 1% of price), the offer needs to be $304k (26.7% below list).
- Only 6 days on market — expect competitive offers; lowballing is unlikely to land.
- Recommended offer: $304k (26.7% below list) — sets the bar for 1% rule.
- In year one you build about $12k of equity ($3k loan paydown + $10k appreciation (2.3% local appreciation)).
- Location reads: area grade D — affects rentability + tenant quality, not the cash-flow math above.
- St. Mary'S County Public Schools (rural): math 23% / reading 38% proficiency, ranked #8 of 24 in MD (top 33%) — families likely to look elsewhere, expect single-tenant / working-renter base with shorter leases.
- Market conditions: Rents rising fast (+6.7%/yr); 65 active listings in the ZIP; high-income renter base; 265 units permitted in St. Mary's County in 2024 (0 in 5+ unit buildings).
- St. Mary's County population projected at +16% by 2050 — long-run rental-demand tailwind backs the buy-and-hold thesis.
- 7 sale attempts since 9y ago with the ask held roughly flat each time — persistent listings suggest the price (not the market) is what's stuck; bring a comps-based counter.
- Current owner paid $280k; 48% above their basis — modest negotiation headroom, anchor on the comps not their cost.
- By year 3, paydown + projected appreciation supports a ~$31k cash-out refi (75% LTV) — recoverable capital for the next deal without selling this one.
- Climate carrying-cost: major wind risk, 63% chance of damaging wind over 30y; moderate wildfire risk; extreme-heat days projected 7→17/yr by 2055 (HVAC capex compounding) — expect insurance premiums to compound above CPI over the hold.
- Cap rate 5.2% vs local median 3.9% in Wildewood — top-decile yield for the area; either an underpriced asset or a hidden risk that comps aren't pricing in. Stress-test before assuming the spread holds.
- This rent runs 31% of the median local income ($119k/yr) — at the standard rent-burdened threshold; future hikes will face affordability resistance.
Questions for listing agent
- What do current leases actually rent for vs. the listed asking? Can we see a recent rent roll and the last 12 months of T-12 income?
- What does the HOA fee cover, when was the last increase, and are there any pending special assessments or reserve-fund shortfalls?
- Is there a deadline driving the sale (1031 exchange, divorce, estate, relocation)? That informs how much negotiation room exists.
- The area grade is low — what's the realistic commute time and amenity access for the typical tenant pool here? Any planned neighborhood developments (good or bad) we should know about?
- What's the average days-on-market for RENTAL listings here right now (not sales)? A rising rental-DOM trend means longer vacancies and softer asking-rent achievability than the comps imply.
- What's the recent tenant-quality profile in this submarket — average credit score on applications, eviction rate, late-payment / NSF rate, and stable-employment percentage? A property-management company in the area should have these aggregated.
- How much new for-sale + rental construction is in the pipeline within 1–3 miles? Heavy new supply typically softens prices + rents 12–24 months out; constrained supply supports both.
CashFlowRE · CFR-F9ESZDAHVB8HJ1
· Data 1 day ago
cashflowre.app · 2026-05-29