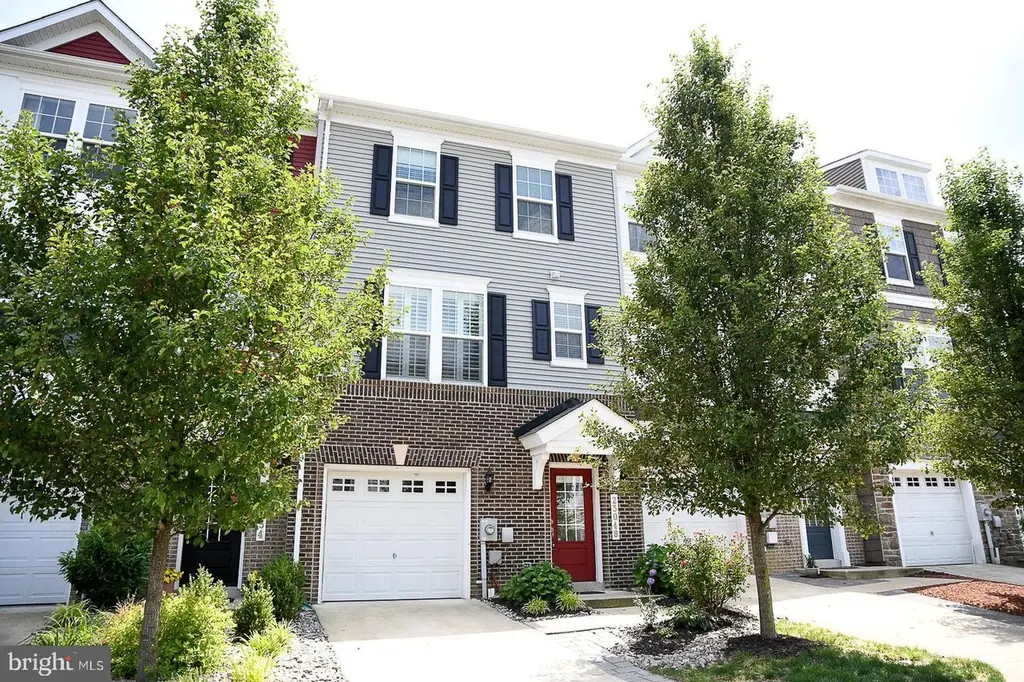
23048 Mountain Laurel Ln · Wildewood, MD
Flood risk 1/10 · Minimal
- FEMA flood zone
- X (unshaded)
- Chance of flooding over 30 yrs
- 0.0%
- Est. flood insurance / yr
- $507 – $1,088
Fire risk 5/10 · Moderate
- Est. fire insurance / yr
- $755 – $1,403
Heat risk 9/10 · Severe
- Hot days now (above 101°F)
- 7 days/yr
- Hot days in 30 yrs
- 17 days/yr
Wind risk 6/10 · Moderate
- Chance of severe wind over 30 yrs
- 63.0%
Air-quality risk 2/10 · Minimal
- Unhealthy air days now
- 2 days/yr
- Unhealthy air days in 30 yrs
- 2 days/yr
Risk factors via First Street. Map © Google.
Why this score? — see what drove the D- grade
The composite is a weighted blend of 9 inputs, each scored 0–100. Each bar is that input's sub-score; the figure is the points it added to the 100-point composite (weight × sub-score).
- Cash flow +8.5/30.0
- Appreciation +6.2/10.0
- ARV discount +4.3/15.0
- Rent growth +4.2/5.0
- Schools +3.0/10.0
- Livability +2.5/5.0
- Condition / age +2.5/5.0
- 1% rule +2.3/10.0
- DSCR +2.3/10.0
$415,000
🖨 Deal sheet 📄 Offer letter ✓ Due diligence
Listing remarks
Welcome to 23048 Mountain Laurel Lane, a beautifully appointed townhome nestled within the highly desirable Wildewood community in California, Maryland. Offering three spacious bedrooms, thoughtfully designed living spaces, and an exceptional location, this residence perfectly balances comfort, style, and convenience. The heart of the home is the well-appointed kitchen, featuring granite countertops, a center island, abundant cabinetry, and a pantry for added storage. Hardwood flooring enhances the main living areas, creating a warm and inviting atmosphere ideal for both everyday living and entertaining. Step outside to the rear deck, the perfect setting for morning coffee, evening relaxati
Key facts
- Bonus room
- Abundant cabinetry
- Granite countertops
Tags
Property features AI
Finance
- Other: Finished above-grade living area reported (assessor source); No basement
- HOA & community: Homeowners association fee $1,523.52 annually
Exterior
- Parking: Attached front-entry garage with 1 garage space; Driveway parking; On-street parking
- Utilities: Public water; Public sewer; Natural gas available; Cable TV available; Hot water supplied by natural gas
- Home design: Interior townhouse/rowhouse; Fee simple ownership
- Construction: Vinyl siding exterior; Slab foundation
- Exterior features: Community pool; No tidal water
Interior
- Kitchen: Kitchen with island; Pantry; Breakfast area; Combination kitchen/dining layout
- Bedrooms: One main-level bedroom; Three upper-level bedrooms
- Flooring: Carpet
- Bathrooms: Three full bathrooms (including one on main level and two on upper level); One half bathroom on an upper level
- Heating & cooling: Heat pump system; Electric and natural gas heating fuel; Central air conditioning; Ceiling fans
- Interior features: Breakfast area; Carpeted areas; Ceiling fans; Combination kitchen/dining area; Family room off the kitchen; Traditional floor plan; Kitchen island; Pantry; Recessed lighting; Walk-in closets; Other interior features
Neighborhood map
What this means for you Summary
Snapshot
- This is a 4-bed/2.5-bath townhouse listed at $415k.
Deal economics
- At list price, monthly cash flow is $-364 ($-4k/yr) — negative.
- To cash-flow at today's rent, offer at most $351k (15.5% below list).
- To meet the 1% rule (rent ≥ 1% of price), the offer needs to be $304k (26.7% below list).
- Recommended offer: $304k (26.7% below list) — sets the bar for 1% rule.
- Cap rate 5.2% vs local median 3.9% in Wildewood — top-decile yield for the area; either an underpriced asset or a hidden risk that comps aren't pricing in. Stress-test before assuming the spread holds.
Location & tenants
- Location reads: area grade D — affects rentability + tenant quality, not the cash-flow math above.
- St. Mary'S County Public Schools (rural): math 23% / reading 38% proficiency, ranked #8 of 24 in MD (top 33%) — families likely to look elsewhere, expect single-tenant / working-renter base with shorter leases.
- Market conditions: Rents rising fast (+6.7%/yr); 65 active listings in the ZIP; high-income renter base; 265 units permitted in St. Mary's County in 2024 (0 in 5+ unit buildings).
- This rent runs 31% of the median local income ($119k/yr) — at the standard rent-burdened threshold; future hikes will face affordability resistance.
Forward outlook
- In year one you build about $12k of equity ($3k loan paydown + $10k appreciation (2.3% local appreciation)).
- St. Mary's County population projected at +16% by 2050 — long-run rental-demand tailwind backs the buy-and-hold thesis.
- By year 3, paydown + projected appreciation supports a ~$31k cash-out refi (75% LTV) — recoverable capital for the next deal without selling this one.
Negotiation context
- Only 6 days on market — expect competitive offers; lowballing is unlikely to land.
- 7 sale attempts since 9y ago with the ask held roughly flat each time — persistent listings suggest the price (not the market) is what's stuck; bring a comps-based counter.
- Current owner paid $280k; 48% above their basis — modest negotiation headroom, anchor on the comps not their cost.
Risks & watch-outs
- Climate carrying-cost: major wind risk, 63% chance of damaging wind over 30y; moderate wildfire risk; extreme-heat days projected 7→17/yr by 2055 (HVAC capex compounding) — expect insurance premiums to compound above CPI over the hold.
Questions for the listing agent
- What do current leases actually rent for vs. the listed asking? Can we see a recent rent roll and the last 12 months of T-12 income?
- What does the HOA fee cover, when was the last increase, and are there any pending special assessments or reserve-fund shortfalls?
- Is there a deadline driving the sale (1031 exchange, divorce, estate, relocation)? That informs how much negotiation room exists.
- The area grade is low — what's the realistic commute time and amenity access for the typical tenant pool here? Any planned neighborhood developments (good or bad) we should know about?
- What's the average days-on-market for RENTAL listings here right now (not sales)? A rising rental-DOM trend means longer vacancies and softer asking-rent achievability than the comps imply.
- What's the recent tenant-quality profile in this submarket — average credit score on applications, eviction rate, late-payment / NSF rate, and stable-employment percentage? A property-management company in the area should have these aggregated.
- How much new for-sale + rental construction is in the pipeline within 1–3 miles? Heavy new supply typically softens prices + rents 12–24 months out; constrained supply supports both.
Investment metrics
- 1% rule
- 0.73% ✗
- Cap rate
- 5.24%
- Cash-on-cash
- -3.76%
- DSCR
- 0.83
- GRM
- 11.4
CMA / ARV
- ARV (on-the-fly)
- $387,276
- Comps found
- 12
Show comp detail 12 sales within ~0.75 mi
| Address | Dist | Beds/Ba | Sqft | Sold | Price | $/sf | Match |
|---|---|---|---|---|---|---|---|
| 43748 Winterberry Way | 0.07mi | 3/3.5 (-1) | 2,165 (-1%) | 3mo | $370,000 | $171 | 83 |
| 23139 Primrose Way | 0.15mi | 4/3.0 | 2,016 (-8%) | 5mo | $381,000 | $189 | 74 |
| 43526 Marguerite Way | 0.30mi | 4/3.5 | 2,080 (-5%) | 4mo | $365,000 | $175 | 70 |
| 43913 Eucalyptus Way | 0.44mi | 4/3.5 | 2,240 (+2%) | 4mo | $415,000 | $185 | 68 |
| 44088 Eucalyptus Way | 0.51mi | 3/3.5 (-1) | 2,183 (-0%) | 0mo | $399,900 | $183 | 67 |
| 44535 River Otter Dr | 0.64mi | 4/3.5 | 2,100 (-4%) | 2mo | $360,000 | $171 | 58 |
| 23115 Azalea Ln | 0.71mi | 3/3.5 (-1) | 2,234 (+2%) | 0mo | $395,000 | $177 | 54 |
| 44180 Beaver Creek Dr | 0.59mi | 3/2.5 (-1) | 2,056 (-6%) | 5mo | $369,900 | $180 | 54 |
| 44285 Beaver Creek Dr | 0.69mi | 4/3.5 | 2,078 (-5%) | 4mo | $365,000 | $176 | 52 |
| 44284 Beaver Creek Dr | 0.67mi | 4/3.5 | 2,060 (-6%) | 6mo | $370,000 | $180 | 50 |
| 44317 Ocelot Way | 0.69mi | 4/3.5 | 2,050 (-6%) | 6mo | $352,000 | $172 | 48 |
| 44045 Fieldstone Way | 0.59mi | 3/2.0 (-1) | 1,903 (-13%) | 2mo | $300,000 | $158 | 42 |
Match score weights: distance 35% · size 25% · config 20% · recency 20%. Top-matched comps best support the ARV.
Projected returns pro-forma
2.3% appreciation · 6.73% rent growth · sell at horizon
- IRR
- 3.6%
- Equity multiple
- 1.20×
- Total profit
- $23,586
- Equity at exit
- $170,575
- IRR
- 9.0%
- Equity multiple
- 2.35×
- Total profit
- $156,392
- Equity at exit
- $251,035
Cash invested: $116,200 (down + closing). Projections, not guarantees.
Landlord ↔ Tenant lean methodology
- Overall (STATE)
- 27 Tenant-Leaning
- State Maryland
- 27 Tenant-Leaning · D+14
- County
- — inherits STATE
- City
- — inherits STATE
ZIP-level market 20619
- Home prices YoY
- 1.0%
- Rents YoY
- 6.7%
- Active inventory
- 65
- Price-to-rent
- 11.4×
Monthly cashflow live
- Estimated rent
- $3,042 medium interval (Pro) →
- Mortgage (P&I)
- −$2,176
- Tax from tax record
- −$290 /mo · $3,485/yr
- Insurance
- −$173
- HOA
- −$127
- Vacancy / Maint / Mgmt
- −$639
- Net cashflow
- $-364
Break-even live
UW: 25.0% down · 7.5% · 30yr · 1.5% tax · 5.0% vac · 8.0% maint · 8.0% mgmt
Financing live
Cash to close
- Down payment
- $103,750
- Closing costs
- $12,450
- Reserves months
- —
- Total cash needed
- —
Loan-product check · same deal, 3 products live
Conventional
25% down · 7.5% · 30yr
- Down + closing
- —
- Monthly P&I
- —
- Monthly cashflow
- —
- DSCR
- —
- Eligible?
- —
Personal DTI + credit; lowest rate.
DSCR
20% down · 8.5% · 30yr
- Down + closing
- —
- Monthly P&I
- —
- Monthly cashflow
- —
- DSCR
- —
- Eligible?
- —
No personal income docs; deal must DSCR.
Hard money
10% down · 12.0% · 12mo
- Down + closing
- —
- Monthly P&I
- —
- Monthly cashflow
- —
- DSCR
- —
- Eligible?
- —
Short-term bridge; refi at stabilization.
HOA detail
- Monthly dues
- $127 · $1,524/yr
Listing history 7 events
-
2026-06-19days on market $415,000 Active 6 DOM
-
2026-06-18days on market $415,000 Active 5 DOM
-
2026-06-17days on market $415,000 Active 4 DOM
-
2026-06-16days on market $415,000 Active 3 DOM
-
2026-06-15days on market $415,000 Active 2 DOM
-
2026-06-14remarks 699-char remark
-
2026-06-14$415,000 Active 1 DOM
ⓘ Source: listings_history table (triggers on properties + properties_extension) + one-shot
backfill from property_details.listing_events for pre-trigger history.
Tax reassessment forecast MD · Partial reset (capped growth)
- Current annual tax
- $3,485 · $290/mo
- Projected year-2 tax
- $4,004 · $334/mo
- Expected delta
- +$519/yr (+$43/mo · 14.9%)
ⓘ Screening estimate from a state-policy table — verify with the county assessor before closing.
Climate risk First Street
- Flood 1/10 Low FEMA zone X (unshaded) · 0% chance over 30 yrs
- Wildfire 5/10 Major
- Heat 9/10 Extreme 7 d/yr ≥101°F today · 17 d/yr by 30 yrs out
- Wind 6/10 Major 63% chance of damaging wind over 30 yrs
- Air quality 2/10 Low 2 unhealthy d/yr today · 2 by 30 yrs out
Nearby sold comps map
Loading sold comps map…
Walkable amenities ~0.75 mi
Loading nearby amenities…
Taxation est. · year 1
- Rental income
- $36,500
- − Mortgage interest
- −$23,246
- − Property taxes
- −$3,485
- − Insurance
- −$2,075
- − Repairs & maintenance
- −$2,920
- − Management
- −$2,920
- − HOA
- −$1,524
- − Depreciation
- −$12,073
- Taxable loss
- −$11,743
- Est. tax savings @ 24.0%
- +$2,818
- After-tax cash flow
- $-1,546/yr
For passive investors: Depreciation is non-cash, so a rental often shows a tax loss while cash-flowing — sheltering income. Rental losses are passive: they offset passive income freely, and up to $25,000/yr can offset ordinary (W-2) income if you actively participate and your MAGI is under $100k (phasing out to $0 by $150k); unused losses carry forward. On sale, claimed depreciation is recaptured at up to 25%, and gains may owe capital-gains tax (a 1031 exchange can defer both). Figures are a year-1 estimate at your 24.0% rate — not tax advice; consult a CPA.
Schools (NCES district)
- District
- St. Mary'S County Public Schools
- NCES district ID
- 2400600
- Math proficiency
- 23% ▼ -23.00%
- Reading proficiency
- 38% ▼ -12.00%
- Median HH income
- $83,240
- Composite
- 29.74/100
- National rank
- #6444
- State rank
- #8 of 24 in MD
Livability — Wildewood
No livability data for this city. (Only ~50 U.S. cities are tracked.)
Census & demographics
- Census place
- Wildewood, MD
- County
- Saint Marys County · 48,152 people
- Metro
- California-Lexington Park, MD
- Population (ZIP)
- 14,212
- Household income
- $119,432
- Rent vs Own
- Severe rent burden
- 357.0
Population outlook (St. Mary's County) Hauer SSP2
- Today (2025)
- 123,125 people
- By 2030
- 128,374 · +4.3%
- By 2040
- 137,305 · +11.5%
- By 2050
- 143,065 · +16.2%
- By 2075
- 153,408 · +24.6%
- By 2100
- 151,790 · +23.3%
Race, ethnicity, and origin ACS 2023
- Neighborhood character
- Predominantly White (68%)
- Race & ethnicity
- White 68% Black 13% Hispanic / Latino 10% Two or more races 6% Asian 5%
- Hispanic origin (detail)
- Mexican 5%
- Common ancestry
- Slovak 3% Iranian 3% Italian 3%
- Foreign-born
- 7% · Canada, Jamaica, Vietnam
- Languages at home
- 90% English-only · Spanish 5% Chinese 1% Tagalog/Filipino 1%
Political lean MEDSL · St. Mary's
- 2024 margin
- R (+17.2) · D 40.2% · R 57.4% · Other 2.4%
- 2008→2024 swing
- -4.4pp toward R · 2008: -12.8pp · 2024: -17.2pp
- All cycles
- 2024: R+17.2 2020: R+13.8 2016: R+24.6 2012: R+16.1 2008: R+12.8
Not yet ingested
- Civics
- —
Market trends
- HPI YoY
- ▲ 2.30%
- Current HPI
- 239.4326
- Rent YoY
- ▲ 6.73%
- Metro
- California-Lexington Park, MD
- State GDP YoY
- ▲ 2.97%
- F500 in state
- 12
Industry mix (Fortune 500 HQ in MD)
| Industry | F500 HQs | Revenue |
|---|---|---|
| Aerospace / Defense | 1 | $71B |
|
||
| Utilities | 1 | $25B |
|
||
| Hotels | 1 | $24B |
|
||
| Consumer Goods | 1 | $7B |
|
||
| Real Estate | 1 | $6B |
|
||
| Chemicals | 1 | $2B |
|
||
Price history
+45.7% since first listed17 events — show timeline
- 2026-06-13 Listed $415,000 BRIGHT MLS
- 2018-03-21 Listing Removed — BRIGHT MLS
- 2018-03-20 Delisted — MRIS
- 2018-03-19 Listing Removed — BRIGHT MLS
- 2018-03-19 Delisted — MRIS
- 2018-03-19 Listed — MRIS
- 2018-03-19 Listed $279,990 BRIGHT MLS
- 2018-03-09 Sold (MLS) $279,995 MRIS
- 2018-03-09 Sold (MLS) $279,995 BRIGHT MLS
- 2017-12-14 Price Changed $279,990 MRIS
- 2017-11-10 Listed $284,925 MRIS
- 2017-11-10 Delisted — MRIS
- 2017-11-10 Listed $279,990 BRIGHT MLS
- 2017-09-25 Price Changed — MRIS
- 2017-09-25 Price Changed — MRIS
- 2017-06-06 Listed — MRIS
- 2017-06-06 Listed $284,925 BRIGHT MLS
Property tax history
+28.9%/yrLatest (2025): $3,485 · +7.3% YoY. Source: county tax records.
Cash-flow waterfall
monthlySold comps — $/sqft
last 12 mo · ≤1 miLoading sold comps…