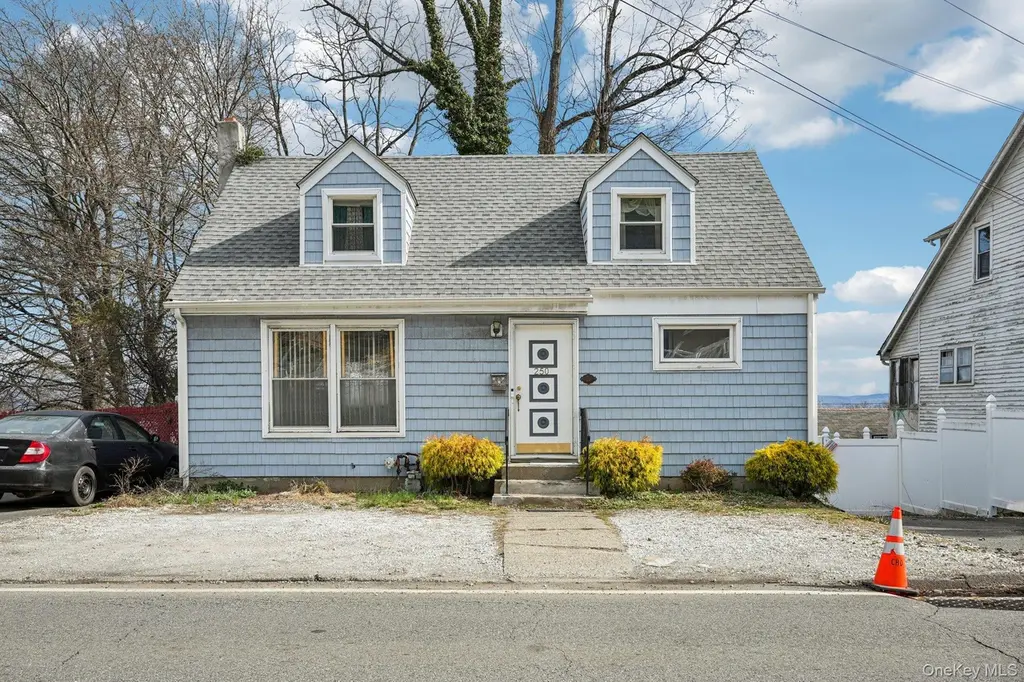
250 Westside Ave
Haverstraw, NY 10927
$428,000D
3 bd · 2.0 ba ·
1,344 sqft ·
Built 1958
· SingleFamily
· Pending
· 27 DOM
Cashflow @ list (25.0% down · 7.5%)
Estimated rent
$3,266/mo
Mortgage (P&I)
−$2,244
Tax + insurance
−$713
HOA
−$0
Vac / Maint / Mgmt
−$686
Net cashflow
$-378/mo
Annual
$-4,536/yr
Cap rate
5.23%
Cash-on-cash
-3.79%
DSCR
0.83
1% rule
0.76%
Cash to close
$119,840
Investor read
- This is a 3-bed/2.0-bath single-family listed at $428k.
- At list price, monthly cash flow is $-378 ($-5k/yr) — negative.
- To cash-flow at today's rent, offer at most $373k (12.8% below list).
- To meet the 1% rule (rent ≥ 1% of price), the offer needs to be $327k (23.7% below list).
- It's been on market 27 days — a 2% lower offer ($422k) is reasonable based on typical stale-listing flexibility.
- Recommended offer: $327k (23.7% below list) — sets the bar for 1% rule.
- Local home prices are declining (-3.0%/yr); year-one equity from $3k of loan paydown is wiped out by about $13k of value loss. Plan a longer hold.
- Location reads 57/100 on livability (#1,087 in NY) — a working-class tenant base; expect higher turnover. Strengths: housing A+, employment B+; Watch: crime D+, schools F, amenities F.
- Haverstraw-Stony Point CSD (North Rockland) (suburban): math 41% / reading 47% proficiency, ranked #427 of 590 in NY (top 72%) — families likely to look elsewhere, expect single-tenant / working-renter base with shorter leases.
- Watch-outs: built in 1958 — expect roof / HVAC / electrical / plumbing capex.
- Market conditions: Rents rising fast (+7.6%/yr); 50 active listings in the ZIP; 17 comparable units currently listed for rent nearby; rentals leasing fast (median 12d on market — plan ~1-2 weeks tenant-placement turnaround); solid renter incomes; 429 units permitted in Rockland County in 2024 (231 in 5+ unit buildings).
- Rockland County population projected at +7% by 2050 — modest demand growth; plan on rents tracking national, not racing it.
- Climate carrying-cost: moderate wildfire risk; extreme-heat days projected 7→15/yr by 2055 (HVAC capex compounding) — expect insurance premiums to compound above CPI over the hold.
- At $3,266/mo this rent would consume 52% of the median local household income ($75k/yr) (locally 791% of renters already pay >50% of income on rent) — very limited rent-growth headroom before tenants either downsize or default.
Questions for listing agent
- What do current leases actually rent for vs. the listed asking? Can we see a recent rent roll and the last 12 months of T-12 income?
- Built in 1958 — when were the roof, HVAC, electrical panel, plumbing, and water heater last replaced?
- Is there a deadline driving the sale (1031 exchange, divorce, estate, relocation)? That informs how much negotiation room exists.
- Schools are F-rated, which usually means shorter tenancies and higher turnover. Who's the typical renter profile here, and what's been the actual vacancy rate?
- Crime grade is D in this area — have there been break-ins, vandalism, or insurance claims at this property in the last 3 years? What carrier currently insures it and at what premium?
- The area grade is low — what's the realistic commute time and amenity access for the typical tenant pool here? Any planned neighborhood developments (good or bad) we should know about?
- What's the average days-on-market for RENTAL listings here right now (not sales)? A rising rental-DOM trend means longer vacancies and softer asking-rent achievability than the comps imply.
- What's the recent tenant-quality profile in this submarket — average credit score on applications, eviction rate, late-payment / NSF rate, and stable-employment percentage? A property-management company in the area should have these aggregated.
CashFlowRE · CFR-FACPMA1ABTKPPZ
· Data 3 weeks ago
cashflowre.app · 2026-05-29