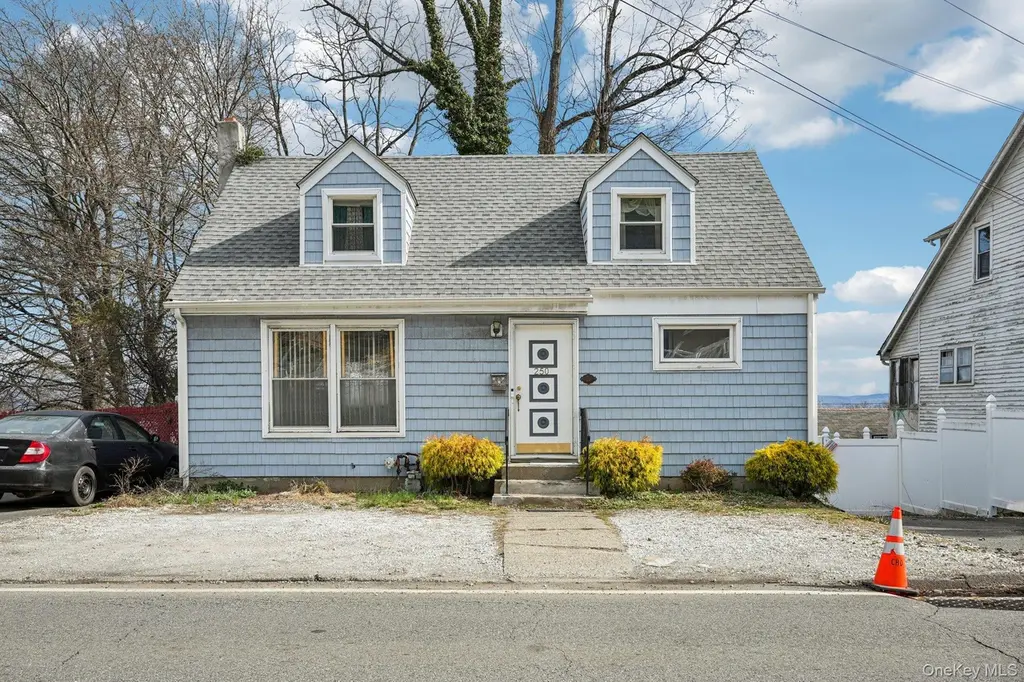
250 Westside Ave · Haverstraw, NY
Flood risk 1/10 · Minimal
- FEMA flood zone
- X (unshaded)
- Chance of flooding over 30 yrs
- 0.0%
- Est. flood insurance / yr
- $473 – $860
Fire risk 5/10 · Moderate
- Est. fire insurance / yr
- $691 – $1,283
Heat risk 6/10 · Moderate
- Hot days now (above 99°F)
- 7 days/yr
- Hot days in 30 yrs
- 15 days/yr
Wind risk 4/10 · Minor
- Chance of severe wind over 30 yrs
- 19.0%
Air-quality risk 3/10 · Minor
- Unhealthy air days now
- 2 days/yr
- Unhealthy air days in 30 yrs
- 3 days/yr
Risk factors via First Street. Map © Google.
Why this score? — see what drove the D grade
The composite is a weighted blend of 9 inputs, each scored 0–100. Each bar is that input's sub-score; the figure is the points it added to the 100-point composite (weight × sub-score).
- ARV discount +14.4/15.0
- Cash flow +8.5/30.0
- Rent growth +4.4/5.0
- Schools +4.1/10.0
- Livability +2.9/5.0
- 1% rule +2.6/10.0
- Condition / age +2.5/5.0
- DSCR +2.3/10.0
- Appreciation +0.0/10.0
$428,000
🖨 Deal sheet 📄 Offer letter ✓ Due diligence
Listing remarks MLS
Charming soft coastal blue Cape Cod–style home with classic curb appeal. Inside, the home offers three comfortable bedrooms, each with nicely proportioned space-thoughtfully laid out so they feel airy and inviting. Sunlight spills through the windows, making the rooms feel bright and cheerful throughout the day. The main living area feature hardwood floors and large windows.The kitchen is large and just off the kitchen a door opens onto a lovely deck overlooking a fully fenced backyard offering some privacy. Altogether, the home blends charm, comfort and functionality. A perfect opportunity to add your personal style and create something special.
Key facts
- Large windows
- Lovely deck
- Cape cod style
Tags
Neighborhood map
What this means for you Summary
Snapshot
- This is a 3-bed/2.0-bath single-family listed at $428k.
Deal economics
- At list price, monthly cash flow is $-378 ($-5k/yr) — negative.
- To cash-flow at today's rent, offer at most $373k (12.8% below list).
- To meet the 1% rule (rent ≥ 1% of price), the offer needs to be $327k (23.7% below list).
- Recommended offer: $327k (23.7% below list) — sets the bar for 1% rule.
Location & tenants
- Location reads 57/100 on livability (#1,087 in NY) — a working-class tenant base; expect higher turnover. Strengths: housing A+, employment B+; Watch: crime D+, schools F, amenities F.
- Haverstraw-Stony Point CSD (North Rockland) (suburban): math 41% / reading 47% proficiency, ranked #427 of 590 in NY (top 72%) — families likely to look elsewhere, expect single-tenant / working-renter base with shorter leases.
- Market conditions: Rents rising fast (+7.6%/yr); 50 active listings in the ZIP; 17 comparable units currently listed for rent nearby; rentals leasing fast (median 11d on market — plan ~1-2 weeks tenant-placement turnaround); solid renter incomes; 429 units permitted in Rockland County in 2024 (231 in 5+ unit buildings).
- At $3,266/mo this rent would consume 52% of the median local household income ($75k/yr) (locally 791% of renters already pay >50% of income on rent) — very limited rent-growth headroom before tenants either downsize or default.
Forward outlook
- Local home prices are declining (-3.0%/yr); year-one equity from $3k of loan paydown is wiped out by about $13k of value loss. Plan a longer hold.
- Rockland County population projected at +7% by 2050 — modest demand growth; plan on rents tracking national, not racing it.
Negotiation context
- It's been on market 27 days — a 2% lower offer ($422k) is reasonable based on typical stale-listing flexibility.
Risks & watch-outs
- Watch-outs: built in 1958 — expect roof / HVAC / electrical / plumbing capex.
- Climate carrying-cost: moderate wildfire risk; extreme-heat days projected 7→15/yr by 2055 (HVAC capex compounding) — expect insurance premiums to compound above CPI over the hold.
Questions for the listing agent
- What do current leases actually rent for vs. the listed asking? Can we see a recent rent roll and the last 12 months of T-12 income?
- Built in 1958 — when were the roof, HVAC, electrical panel, plumbing, and water heater last replaced?
- Is there a deadline driving the sale (1031 exchange, divorce, estate, relocation)? That informs how much negotiation room exists.
- Schools are F-rated, which usually means shorter tenancies and higher turnover. Who's the typical renter profile here, and what's been the actual vacancy rate?
- Crime grade is D in this area — have there been break-ins, vandalism, or insurance claims at this property in the last 3 years? What carrier currently insures it and at what premium?
- The area grade is low — what's the realistic commute time and amenity access for the typical tenant pool here? Any planned neighborhood developments (good or bad) we should know about?
- What's the average days-on-market for RENTAL listings here right now (not sales)? A rising rental-DOM trend means longer vacancies and softer asking-rent achievability than the comps imply.
- What's the recent tenant-quality profile in this submarket — average credit score on applications, eviction rate, late-payment / NSF rate, and stable-employment percentage? A property-management company in the area should have these aggregated.
- How much new for-sale + rental construction is in the pipeline within 1–3 miles? Heavy new supply typically softens prices + rents 12–24 months out; constrained supply supports both.
Investment metrics
- 1% rule
- 0.76% ✗
- Cap rate
- 5.23%
- Cash-on-cash
- -3.79%
- DSCR
- 0.83
- GRM
- 10.9
CMA / ARV
- ARV (median comp)
- $506,147
- List price
- $428,000
- Delta
- -15.44%
- Verdict
- UNDERPRICED
- Comps
- 20 within 1.0 mi
Show comp detail 12 sales within ~0.75 mi
| Address | Dist | Beds/Ba | Sqft | Sold | Price | $/sf | Match |
|---|---|---|---|---|---|---|---|
| 166 Halgren Cres | 0.28mi | 3/1.5 | 1,440 (+7%) | 0mo | $405,000 | $281 | 73 |
| 9 Simenovsky Dr | 0.29mi | 3/2.5 | 1,460 (+9%) | 3mo | $509,000 | $349 | 68 |
| 30 Hillside Ave | 0.40mi | 3/1.5 | 1,440 (+7%) | 1mo | $422,000 | $293 | 66 |
| 43 Zugibe Ct | 0.71mi | 3/2.5 | 1,350 (+0%) | 3mo | $375,250 | $278 | 61 |
| 12 Hillside Ave | 0.43mi | 3/1.5 | 1,480 (+10%) | 4mo | $400,000 | $270 | 57 |
| 80 Kennedy Dr | 0.67mi | 3/1.5 | 1,404 (+4%) | 3mo | $380,000 | $271 | 57 |
| 28 Hillside Ave | 0.41mi | 4/1.5 (+1) | 1,480 (+10%) | 1mo | $380,000 | $257 | 56 |
| 33 W Overlook Rd | 0.35mi | 3/1.5 | 1,520 (+13%) | 6mo | $425,000 | $280 | 55 |
| 31 Farley Dr | 0.71mi | 3/1.5 | 1,395 (+4%) | 5mo | $397,000 | $285 | 54 |
| 13 Overlook Rd | 0.39mi | 3/1.5 | 1,520 (+13%) | 5mo | $400,000 | $263 | 54 |
| 33 Peck St | 0.66mi | 3/1.0 | 1,245 (-7%) | 5mo | $469,000 | $377 | 49 |
| 25 Wayne Ave | 0.69mi | 3/1.0 | 1,214 (-10%) | 5mo | $510,000 | $420 | 44 |
Match score weights: distance 35% · size 25% · config 20% · recency 20%. Top-matched comps best support the ARV.
Projected returns pro-forma
-3.0% appreciation · 7.62% rent growth · sell at horizon
- IRR
- -17.6%
- Equity multiple
- 0.35×
- Total profit
- $-77,493
- Equity at exit
- $63,816
- IRR
- -2.7%
- Equity multiple
- 0.78×
- Total profit
- $-26,550
- Equity at exit
- $37,006
Cash invested: $119,840 (down + closing). Projections, not guarantees.
Landlord ↔ Tenant lean methodology
- Overall (STATE)
- 15 Strongly Tenant-Friendly
- State New York
- 15 Strongly Tenant-Friendly · D+10
- County
- — inherits STATE
- City
- — inherits STATE
ZIP-level market 10927
- Home prices YoY
- -23.6%
- Rents YoY
- 7.6%
- Active inventory
- 50
- Price-to-rent
- 10.9×
Monthly cashflow live
- Estimated rent
- $3,266 high interval (Pro) →
- Mortgage (P&I)
- −$2,244
- Tax est. 1.5%
- −$535 /mo · $6,420/yr
- Insurance
- −$178
- HOA
- −$0
- Vacancy / Maint / Mgmt
- −$686
- Net cashflow
- $-378
Break-even live
UW: 25.0% down · 7.5% · 30yr · 1.5% tax · 5.0% vac · 8.0% maint · 8.0% mgmt
Financing live
Cash to close
- Down payment
- $107,000
- Closing costs
- $12,840
- Reserves months
- —
- Total cash needed
- —
Loan-product check · same deal, 3 products live
Conventional
25% down · 7.5% · 30yr
- Down + closing
- —
- Monthly P&I
- —
- Monthly cashflow
- —
- DSCR
- —
- Eligible?
- —
Personal DTI + credit; lowest rate.
DSCR
20% down · 8.5% · 30yr
- Down + closing
- —
- Monthly P&I
- —
- Monthly cashflow
- —
- DSCR
- —
- Eligible?
- —
No personal income docs; deal must DSCR.
Hard money
10% down · 12.0% · 12mo
- Down + closing
- —
- Monthly P&I
- —
- Monthly cashflow
- —
- DSCR
- —
- Eligible?
- —
Short-term bridge; refi at stabilization.
Rent comps 17 comps
| Address | Beds | Baths | Sqft | Rent | $/sqft | DOM | Units | Dist |
|---|---|---|---|---|---|---|---|---|
| 27-29-31 Lakeview Ct Unit 29 Haverstraw, NY | 2.0 | 1.0 | 1200 | $2,550 | $2.12 | 10d | 1 | 0.24mi |
| 56 Coolidge St Unit 2 Haverstraw, NY | 4.0 | 1.5 | 1400 | $3,500 | $2.50 | 4d | 1 | 0.25mi |
| 56 Coolidge St Haverstraw, NY | 3.0 | 1.5 | 1440 | $3,500 | $2.43 | 11d | 1 | 0.25mi |
| 100 Westside Ave Unit 2 Haverstraw, NY | 3.0 | 1.0 | 1492 | $2,485 | $1.67 | 1d | 1 | 0.26mi |
| 156 Coolidge St Haverstraw, NY | 3.0 | 1.5 | 1600 | $3,200 | $2.00 | 20d | 1 | 0.34mi |
| 1 Kensington Cir Haverstraw, NY | 1.0–2.0 | 1.0 | 1017 | $2,975 | $2.92 | 1d | 3 | 0.48mi |
| 22 Westside Ave Haverstraw, NY | 3.0 | 2.0 | 1260 | $3,200 | $2.54 | 43d | 1 | 0.50mi |
| 58 Samsondale Ave Unit A West Haverstraw, NY | 3.0 | 2.0 | 1512 | $3,300 | $2.18 | 18d | 1 | 0.62mi |
| 126 Roosevelt Dr West Haverstraw, NY | 3.0 | 1.5 | 1404 | $3,600 | $2.56 | 43d | 1 | 0.63mi |
| 42 Peck St West Haverstraw, NY | 2.0 | 2.0 | 1000 | $2,950 | $2.95 | 43d | 1 | 0.64mi |
| 19 Conger Ave Unit 2 Haverstraw, NY | 2.0 | 1.0 | 900 | $2,750 | $3.06 | 43d | 1 | 0.74mi |
| 12 Roosevelt Dr West Haverstraw, NY | 3.0 | 1.5 | 1400 | $3,600 | $2.57 | 16d | 1 | 0.80mi |
| 11 Brush Ct Garnerville, NY | 2.0 | 1.0 | 1100 | $2,500 | $2.27 | 7d | 1 | 0.91mi |
| 31 N Wayne Ave West Haverstraw, NY | 3.0 | 2.0 | 1080 | $3,400 | $3.15 | 24d | 1 | 0.94mi |
| 1100 Admirals Cove Blvd Haverstraw, NY | 2.0 | 1.0–2.0 | 887 | $6,095 | $6.87 | 1d | 36 | 1.29mi |
| 2100 Round Pointe Dr Haverstraw, NY | 1.0–2.0 | 1.5–2.0 | 1143 | $4,295 | $3.76 | 1d | 7 | 1.35mi |
| 4100 Southerly Pointe Dr Haverstraw, NY | 2.0 | 1.0–2.5 | 1055 | $4,450 | $4.22 | 1d | 7 | 1.44mi |
Listing history 2 events
-
2026-05-08status Pending 662-char remark
Show marketing remark (662 chars)
Charming soft coastal blue Cape Cod–style home with classic curb appeal. Inside, the home offers three comfortable bedrooms, each with nicely proportioned space-thoughtfully laid out so they feel airy and inviting. Sunlight spills through the windows, making the rooms feel bright and cheerful throughout the day. The main living area feature hardwood floors and large windows.The kitchen is large and just off the kitchen a door opens onto a lovely deck overlooking a fully fenced backyard offering some privacy. Altogether, the home blends charm, comfort and functionality. A perfect opportunity to add your personal style and create something special.
-
2026-04-06$428,000 Active 662-char remark
Show marketing remark (662 chars)
Charming soft coastal blue Cape Cod–style home with classic curb appeal. Inside, the home offers three comfortable bedrooms, each with nicely proportioned space-thoughtfully laid out so they feel airy and inviting. Sunlight spills through the windows, making the rooms feel bright and cheerful throughout the day. The main living area feature hardwood floors and large windows.The kitchen is large and just off the kitchen a door opens onto a lovely deck overlooking a fully fenced backyard offering some privacy. Altogether, the home blends charm, comfort and functionality. A perfect opportunity to add your personal style and create something special.
ⓘ Source: listings_history table (triggers on properties + properties_extension) + one-shot
backfill from property_details.listing_events for pre-trigger history.
Climate risk First Street
- Flood 1/10 Low FEMA zone X (unshaded) · 0% chance over 30 yrs
- Wildfire 5/10 Major
- Heat 6/10 Major 7 d/yr ≥99°F today · 15 d/yr by 30 yrs out
- Wind 4/10 Moderate 19% chance of damaging wind over 30 yrs
- Air quality 3/10 Moderate 2 unhealthy d/yr today · 3 by 30 yrs out
Nearby sold comps map
Loading sold comps map…
Walkable amenities ~0.75 mi
Loading nearby amenities…
Taxation est. · year 1
- Rental income
- $39,187
- − Mortgage interest
- −$23,975
- − Property taxes
- −$6,420
- − Insurance
- −$2,140
- − Repairs & maintenance
- −$3,135
- − Management
- −$3,135
- − Depreciation
- −$12,451
- Taxable loss
- −$12,068
- Est. tax savings @ 24.0%
- +$2,896
- After-tax cash flow
- $-1,640/yr
For passive investors: Depreciation is non-cash, so a rental often shows a tax loss while cash-flowing — sheltering income. Rental losses are passive: they offset passive income freely, and up to $25,000/yr can offset ordinary (W-2) income if you actively participate and your MAGI is under $100k (phasing out to $0 by $150k); unused losses carry forward. On sale, claimed depreciation is recaptured at up to 25%, and gains may owe capital-gains tax (a 1031 exchange can defer both). Figures are a year-1 estimate at your 24.0% rate — not tax advice; consult a CPA.
Schools (NCES district)
- District
- Haverstraw-Stony Point CSD (North Rockland)
- NCES district ID
- 3614010
- Math proficiency
- 41% ▼ -7.00%
- Reading proficiency
- 47% ▼ -1.00%
- Median HH income
- $80,218
- Composite
- 40.68/100
- National rank
- #3672
- State rank
- #427 of 590 in NY
Livability — Haverstraw
- Score
- 57/100
- State rank
- #1087
- US rank
- #21649
Category grades
Schools grade is shown separately in the Schools card above.
Census & demographics
- Census place
- Haverstraw, NY
- County
- Rockland County · 98,828 people
- City population
- 12,325
- Metro
- New York-Newark-Jersey City, NY-NJ-PA
- Population (ZIP)
- 12,325
- Household income
- $75,167
- Rent vs Own
- Severe rent burden
- 791.0
Population outlook (Rockland County) Hauer SSP2
- Today (2025)
- 339,642 people
- By 2030
- 345,987 · +1.9%
- By 2040
- 357,178 · +5.2%
- By 2050
- 362,456 · +6.7%
- By 2075
- 367,281 · +8.1%
- By 2100
- 328,211 · -3.4%
Race, ethnicity, and origin ACS 2023
- Neighborhood character
- Diverse neighborhood (Simpson 0.57)
- Race & ethnicity
- Hispanic / Latino 61% Two or more races 24% White 18% Black 17% Asian 3% Native American 2%
- Hispanic origin (detail)
- Mexican 3% Puerto Rican 8% Dominican 32%
- Common ancestry
- Hispanic 5% Romanian 1% Scotch-Irish 1%
- Foreign-born
- 43% · Canada, Dominican Republic, Guatemala
- Languages at home
- 38% English-only · Spanish 53% French/Haitian/Cajun 6% Other Asian/Pacific 2%
Political lean MEDSL · Rockland
- 2024 margin
- R (+11.8) · D 44.1% · R 55.9%
- 2008→2024 swing
- -17.7pp toward R · 2008: 5.9pp · 2024: -11.8pp
- All cycles
- 2024: R+11.8 2020: D+1.7 2016: D+5.1 2012: D+6.6 2008: D+5.9
Not yet ingested
- Civics
- —
Market trends
- HPI YoY
- ▼ -73.63%
- Current HPI
- 238.4313
- Rent YoY
- ▲ 7.62%
- Metro
- New York-Newark-Jersey City, NY-NJ-PA
- State GDP YoY
- ▲ 2.60%
- F500 in state
- 92
Industry mix (Fortune 500 HQ in NY)
| Industry | F500 HQs | Revenue |
|---|---|---|
| Financial Services | 10 | $950B |
|
||
| Consumer Goods | 9 | $162B |
|
||
| Insurance | 4 | $225B |
|
||
| Telecommunications | 2 | $144B |
|
||
| Pharmaceuticals | 2 | $112B |
|
||
| Media / Entertainment | 2 | $69B |
|
||
Price history
2 events — show timeline
- 2026-05-08 Pending — OneKey® MLS as Distributed by MLS Grid
- 2026-04-06 Listed $428,000 OneKey® MLS as Distributed by MLS Grid
Property tax history
+18.8%/yrLatest (2025): $52,973 · +7.1% YoY. Source: county tax records.
Cash-flow waterfall
monthlySold comps — $/sqft
last 12 mo · ≤1 miLoading sold comps…