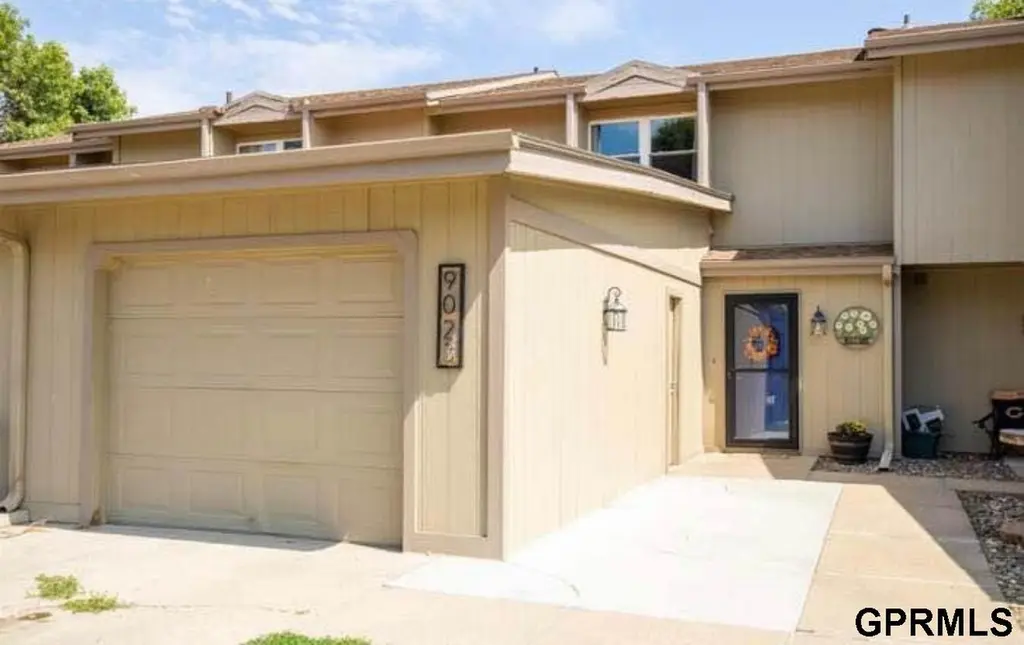
9023 Gary Cir
Chalco, NE 68138
$245,000D-
3 bd · 2.0 ba ·
1,388 sqft ·
Built 1975
· Townhouse
· Active
· 14 DOM
Cashflow @ list (25.0% down · 7.5%)
Estimated rent
$2,026/mo
Mortgage (P&I)
−$1,285
Tax + insurance
−$386
HOA
−$13
Vac / Maint / Mgmt
−$425
Net cashflow
$-83/mo
Annual
$-997/yr
Cap rate
5.89%
Cash-on-cash
-1.45%
DSCR
0.94
1% rule
0.83%
Cash to close
$68,600
Investor read
- This is a 3-bed/2.0-bath townhouse listed at $245k.
- At list price, monthly cash flow is $-83 ($-997/yr) — negative.
- To cash-flow at today's rent, offer at most $230k (6.0% below list).
- To meet the 1% rule (rent ≥ 1% of price), the offer needs to be $203k (17.3% below list).
- Only 14 days on market — expect competitive offers; lowballing is unlikely to land.
- Recommended offer: $203k (17.3% below list) — sets the bar for 1% rule.
- Local home prices are declining (-3.0%/yr); year-one equity from $2k of loan paydown is wiped out by about $7k of value loss. Plan a longer hold.
- Location reads 79/100 on livability (#46 in NE, #2,335 nationally) — a middle-class / working-renter tenant base. Strengths: employment A+, cost of living A+, housing A+; Watch: amenities F, commute F.
- Millard Public Schools (urban): math 58% / reading 60% proficiency, ranked #13 of 111 in NE (top 12%) — acceptable for families but not a draw, mixed tenant base, ~2y average lease; only 13% free/reduced lunch — higher-income household profile.
- Zoned schools: Norris Elementary School (math 42% / reading 52%, grade D-, #266 of 502 statewide, top 56%, 431 students, 48% FRL); Millard Central Middle School (math 39% / reading 41%, grade F, #84 of 128 statewide, top 65%, 825 students, 47% FRL); Millard South High School (math 51% / reading 54%, grade C-, #97 of 261 statewide, top 37%, 2,607 students, 36% FRL) — zoned schools average 44% FRL vs 13% district-wide (30 pts higher); higher-poverty schools than district average — tighter screening recommended.
- Zoned-school proficiency averages 46% at this address vs 59% district-wide (-12 pts) — the specific schools serving this property underperform the Millard Public Schools average; the district grade overstates school quality for this exact location.
- Market conditions: Rents rising (+3.7%/yr); 71 active listings in the ZIP; 11 comparable units currently listed for rent nearby; rentals leasing fast (median 4d on market — plan ~1-2 weeks tenant-placement turnaround); solid renter incomes; 1,612 units permitted in Sarpy County in 2024 (364 in 5+ unit buildings).
- Sarpy County population projected at +41% by 2050 — long-run rental-demand tailwind backs the buy-and-hold thesis.
- 5 sale attempts since 17y ago with the ask held roughly flat each time — persistent listings suggest the price (not the market) is what's stuck; bring a comps-based counter.
- Current owner paid $170k; 44% above their basis — modest negotiation headroom, anchor on the comps not their cost.
- Cap rate 5.9% vs local median 4.4% in Chalco — top-decile yield for the area; either an underpriced asset or a hidden risk that comps aren't pricing in. Stress-test before assuming the spread holds.
Questions for listing agent
- What do current leases actually rent for vs. the listed asking? Can we see a recent rent roll and the last 12 months of T-12 income?
- Built in 1975 — when were the roof, HVAC, electrical panel, plumbing, and water heater last replaced?
- What does the HOA fee cover, when was the last increase, and are there any pending special assessments or reserve-fund shortfalls?
- Is there a deadline driving the sale (1031 exchange, divorce, estate, relocation)? That informs how much negotiation room exists.
- The area grade is low — what's the realistic commute time and amenity access for the typical tenant pool here? Any planned neighborhood developments (good or bad) we should know about?
- What's the average days-on-market for RENTAL listings here right now (not sales)? A rising rental-DOM trend means longer vacancies and softer asking-rent achievability than the comps imply.
- What's the recent tenant-quality profile in this submarket — average credit score on applications, eviction rate, late-payment / NSF rate, and stable-employment percentage? A property-management company in the area should have these aggregated.
- How much new for-sale + rental construction is in the pipeline within 1–3 miles? Heavy new supply typically softens prices + rents 12–24 months out; constrained supply supports both.
CashFlowRE · CFR-FAR0PHB2SZ4Q6S
· Data 3 days ago
cashflowre.app · 2026-05-29